
During late January and February of 2022, I had the opportunity to join Will Rourk as he scanned the interior of Thomas Jefferson’s Monticello. Due to the size and complexity of the house, as well as the need to schedule our scanning work around the presence of visitors, the work took several weeks. I spent the last few days exclusively scanning the southern dependency wing, almost entirely on my own.
registration
When the time came for our class to work on registering and processing the data, we each chose a section to work on. The number of scans we had captured made the project far too large to complete as part of a semester’s work. I, naturally, chose to work with the data I had captured myself, the south dependency wing.
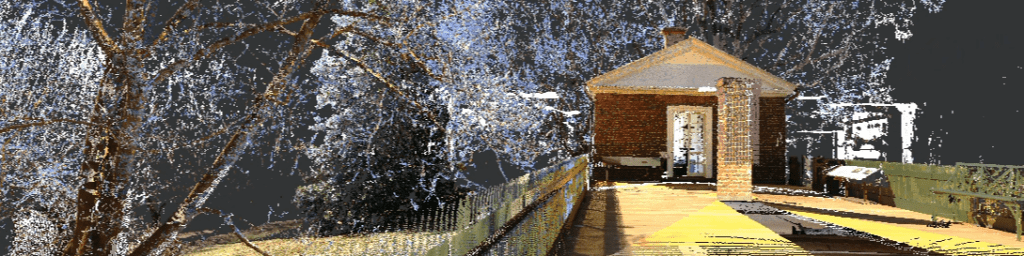
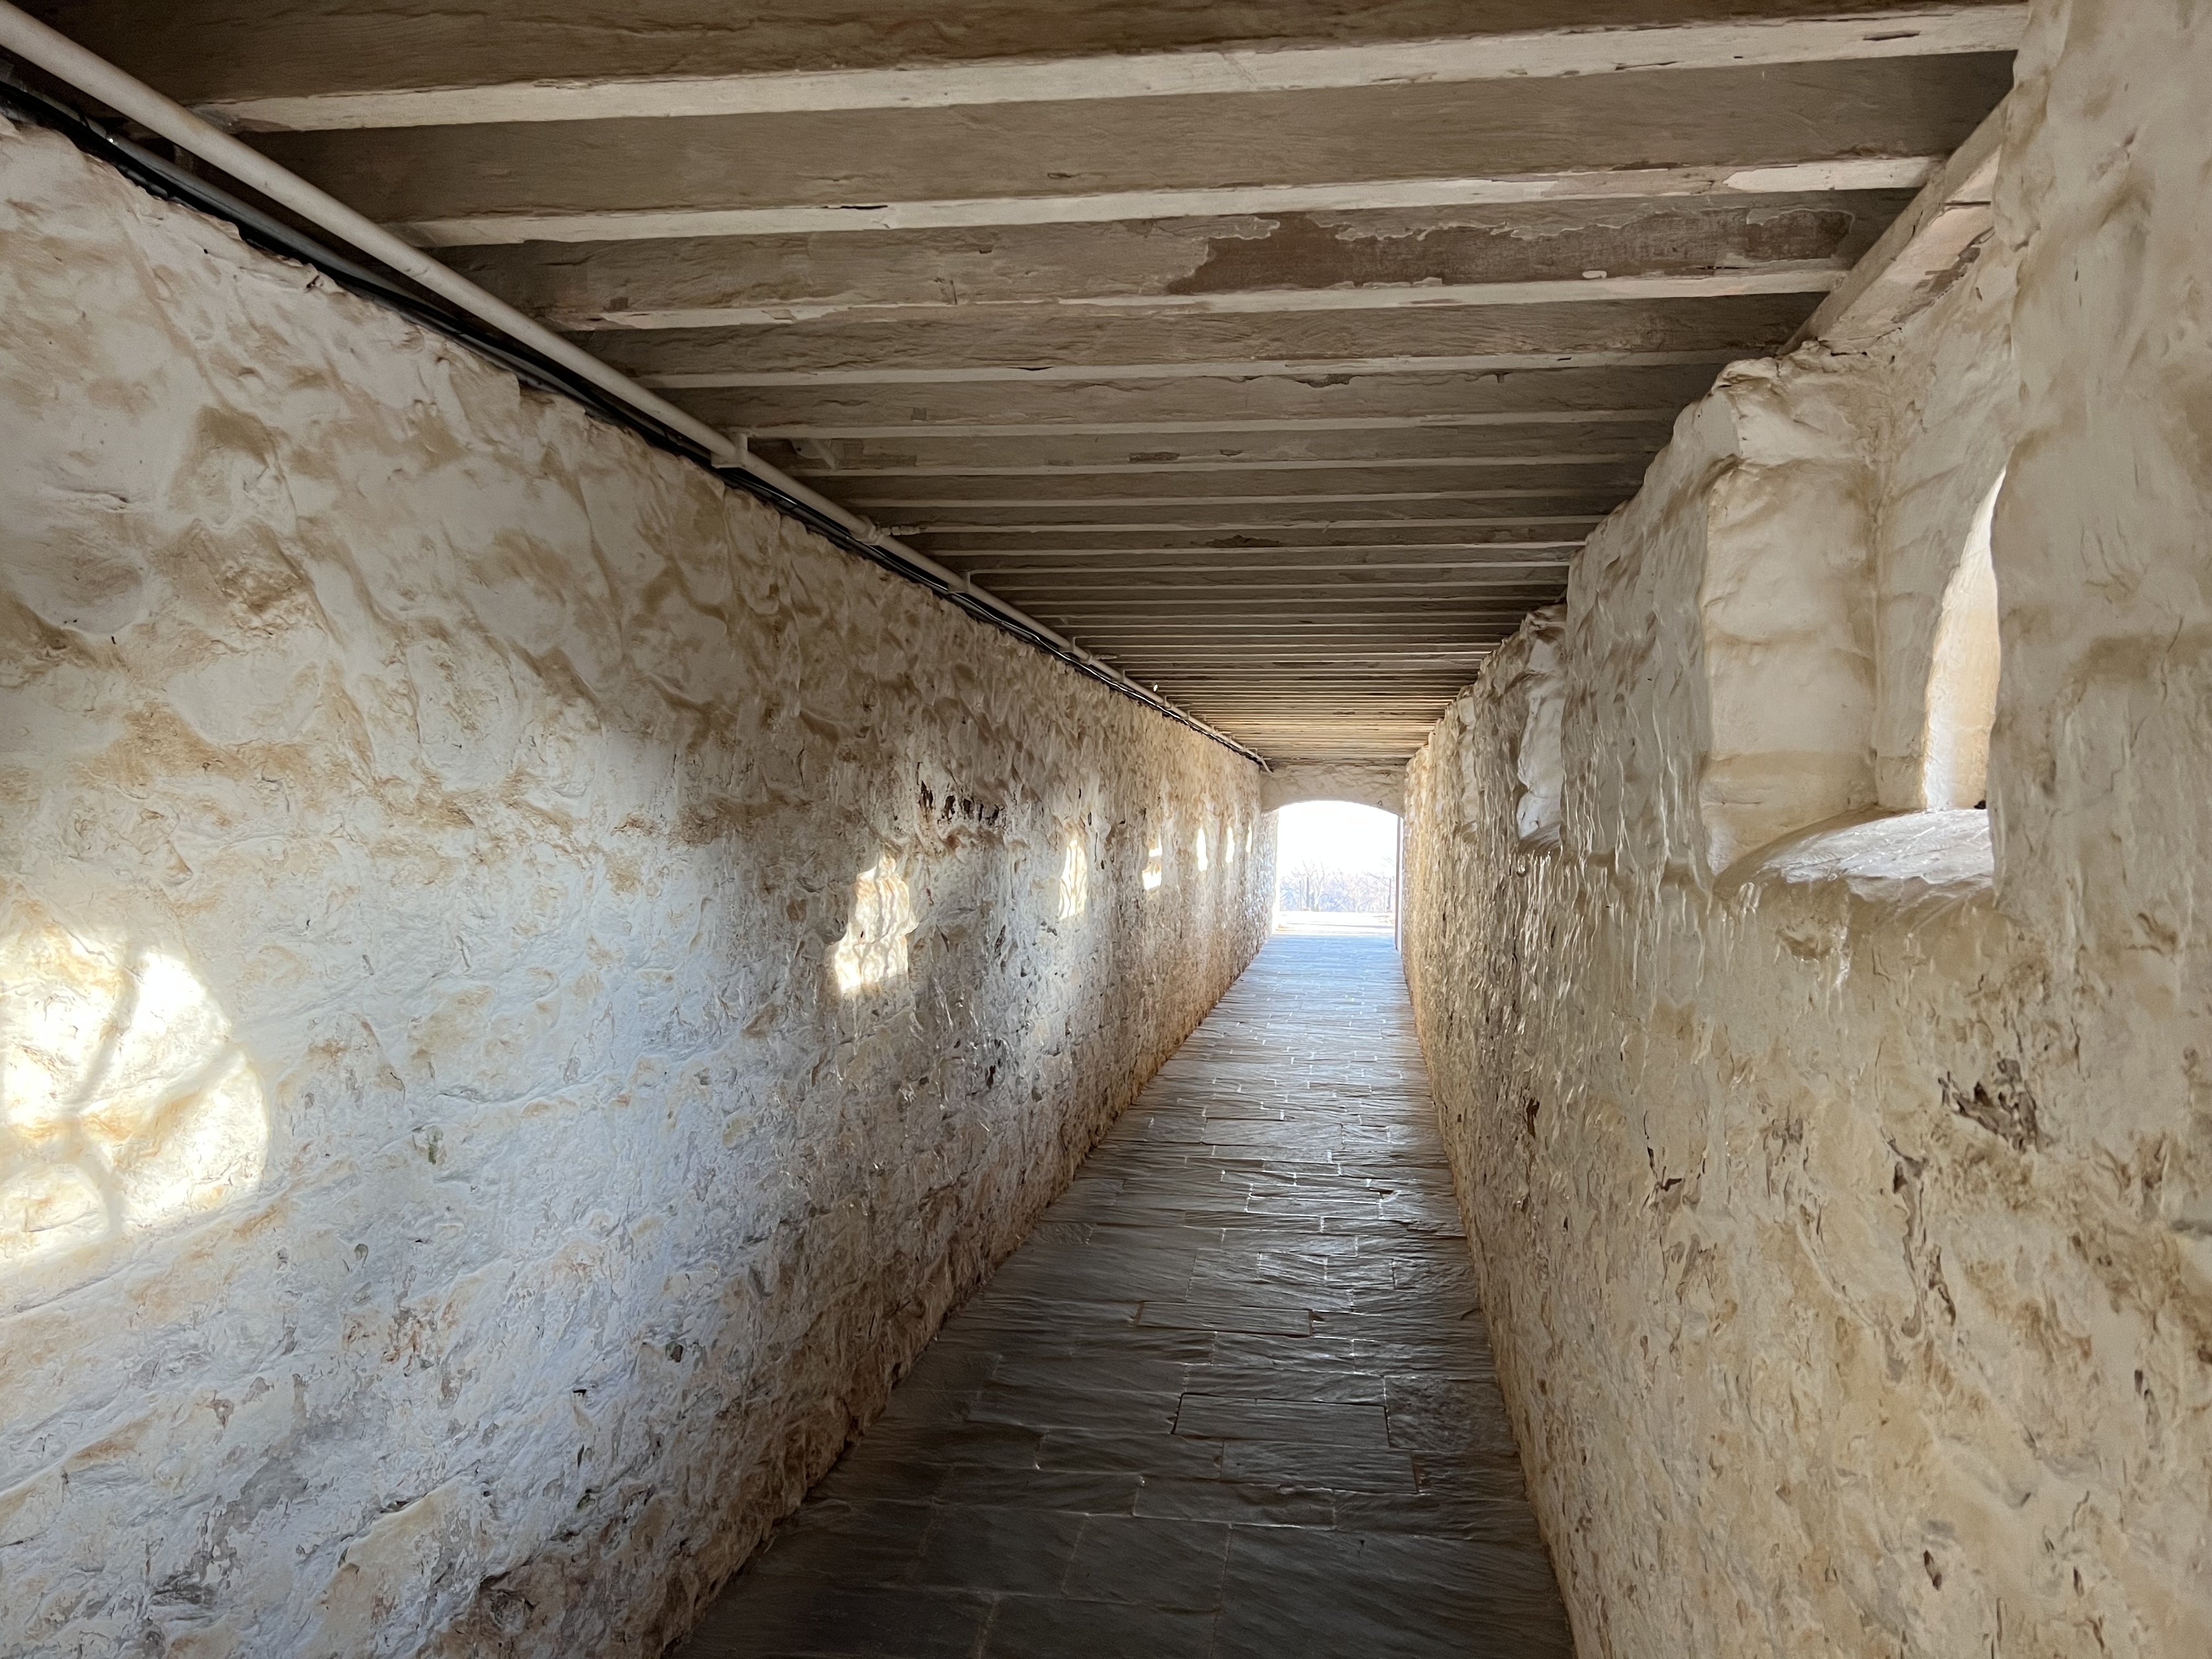
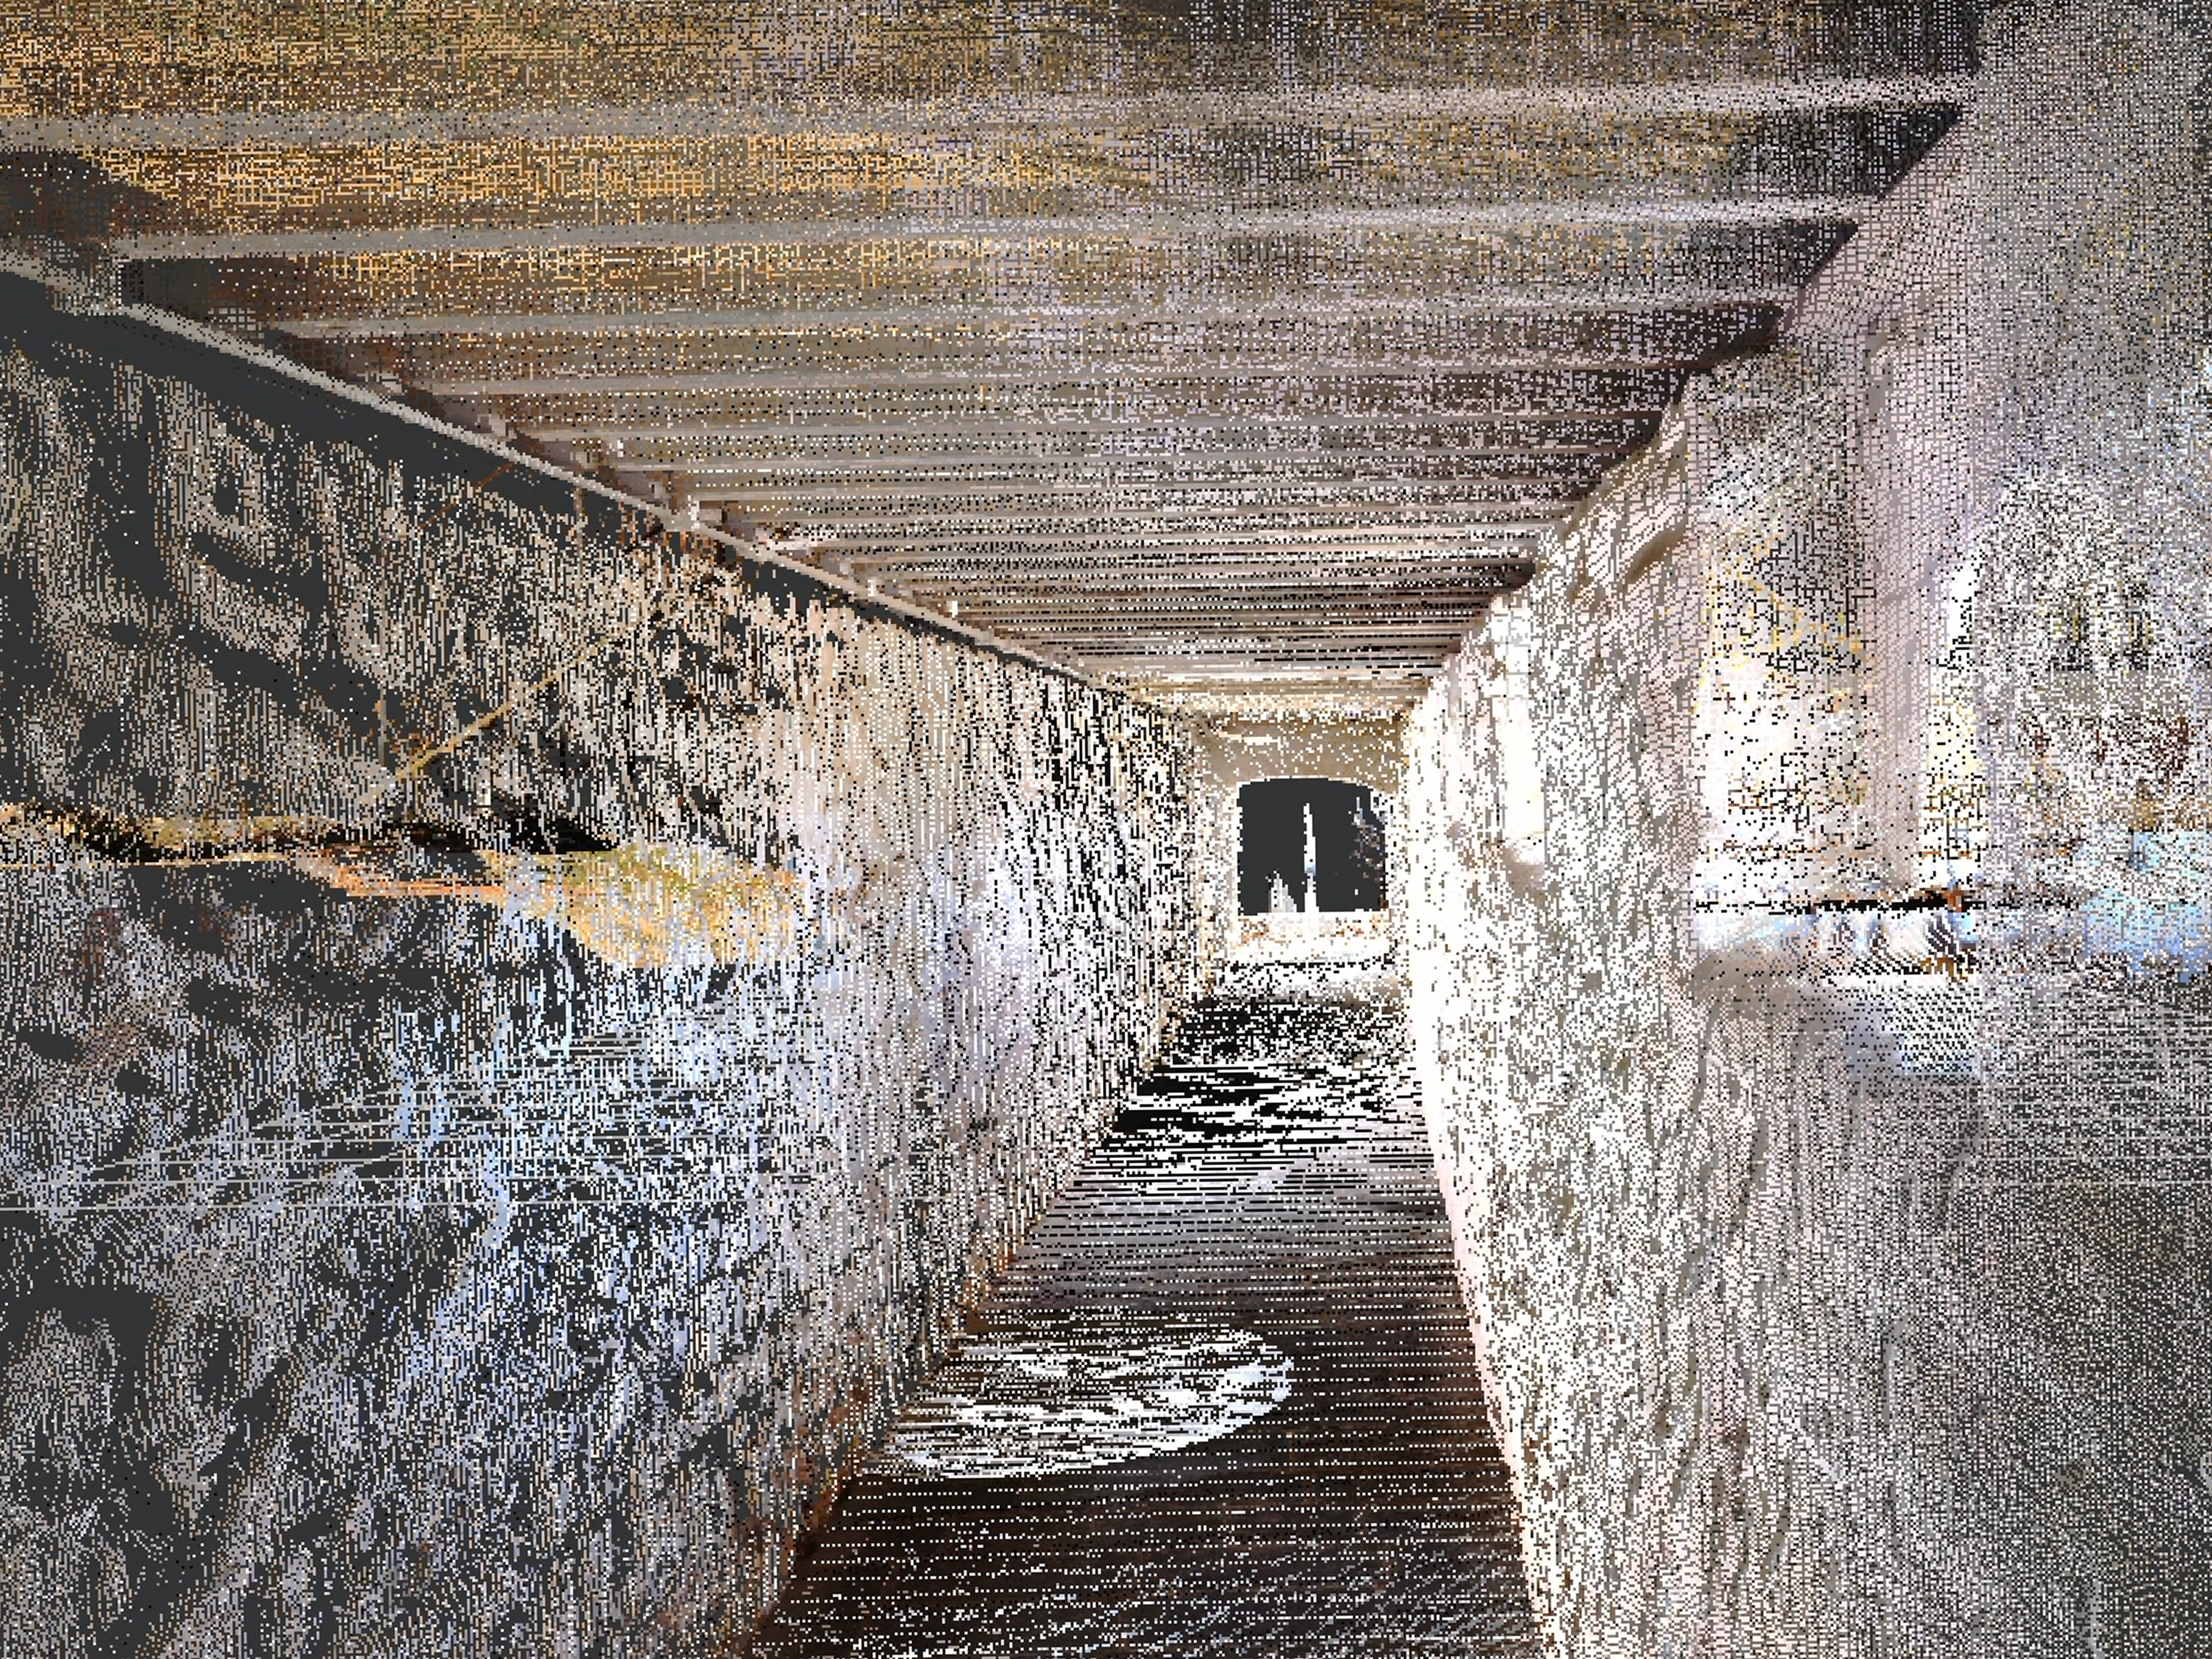
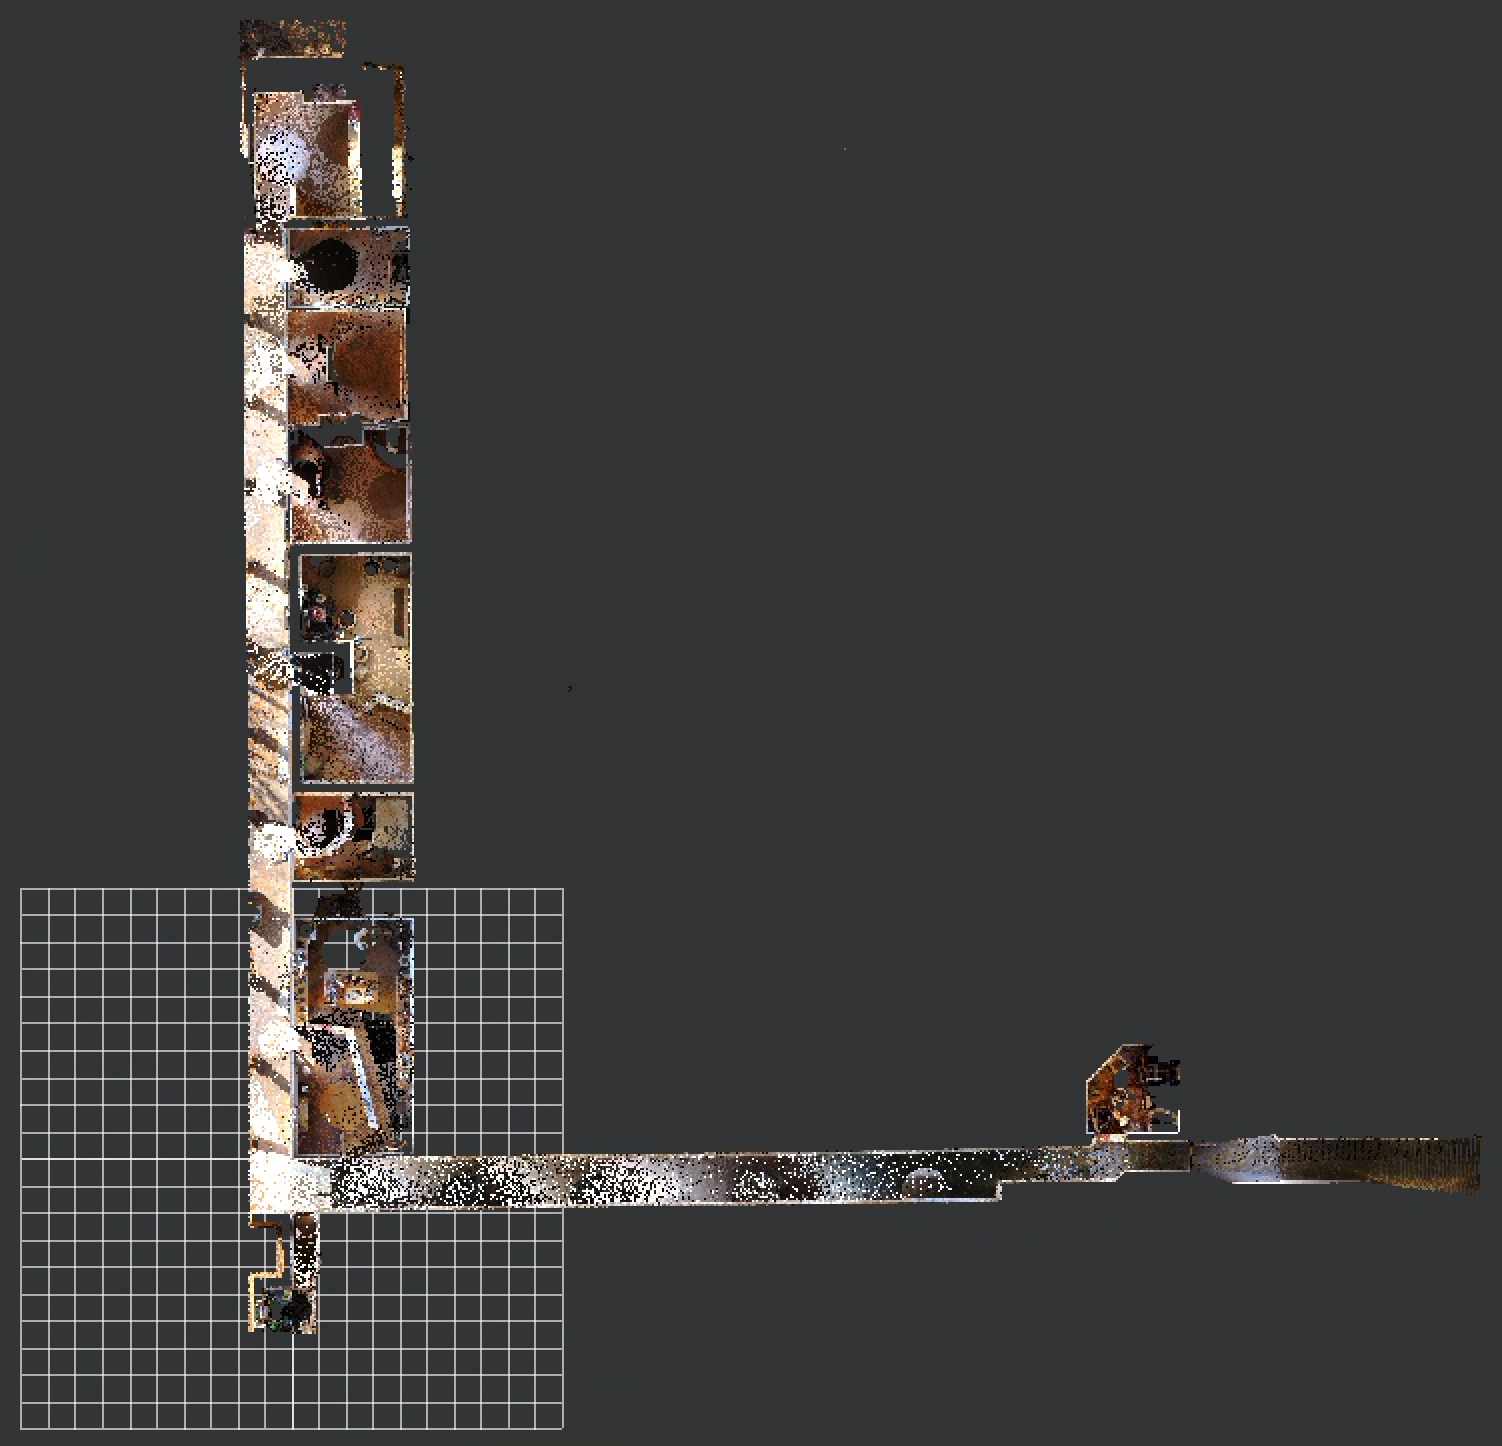
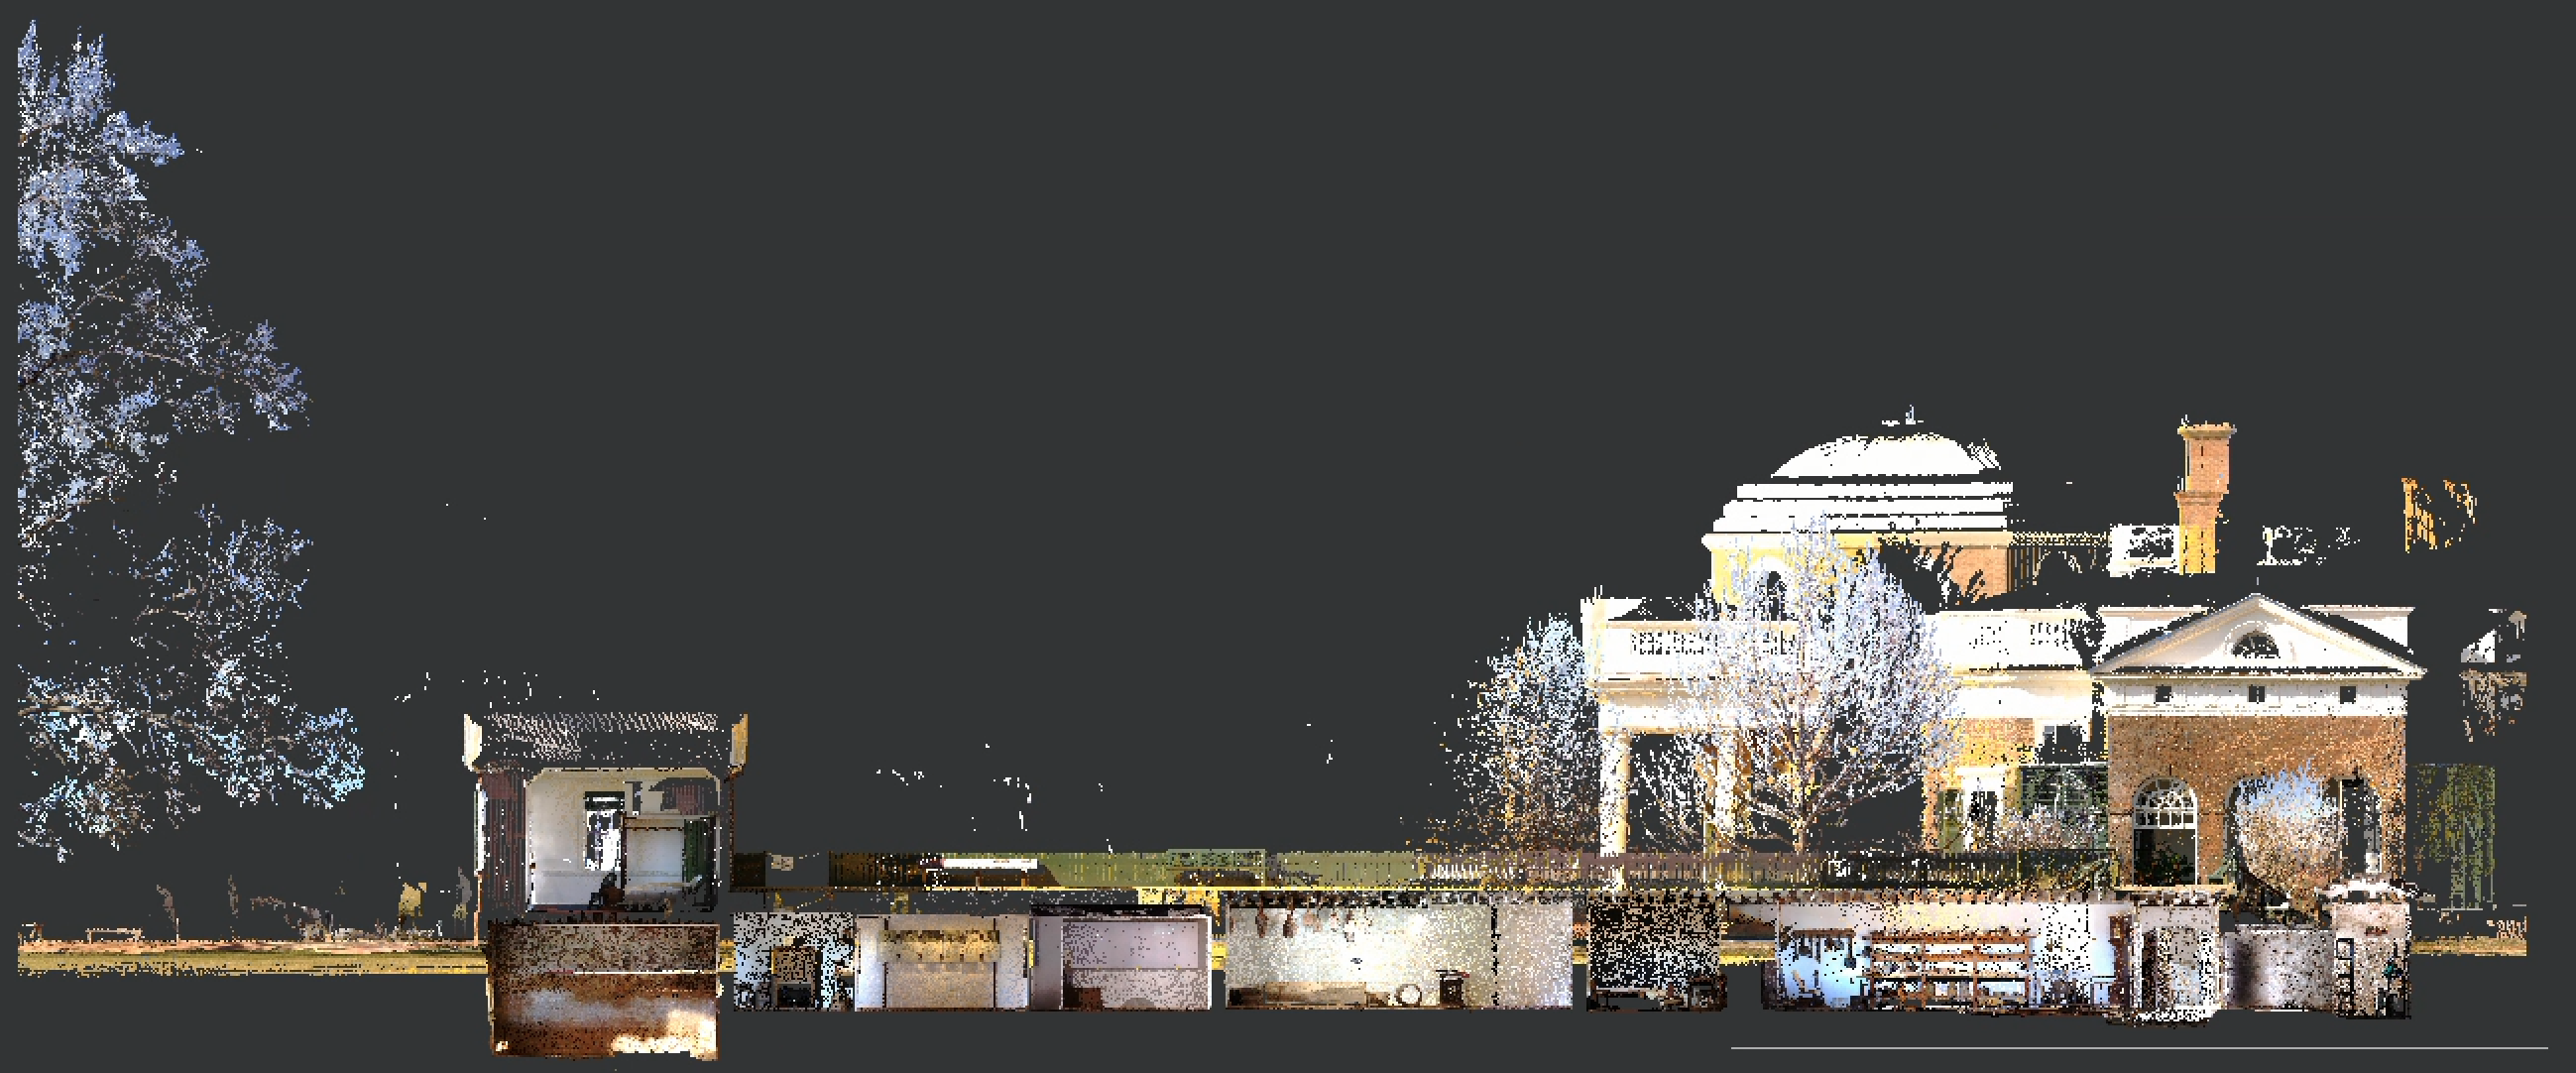
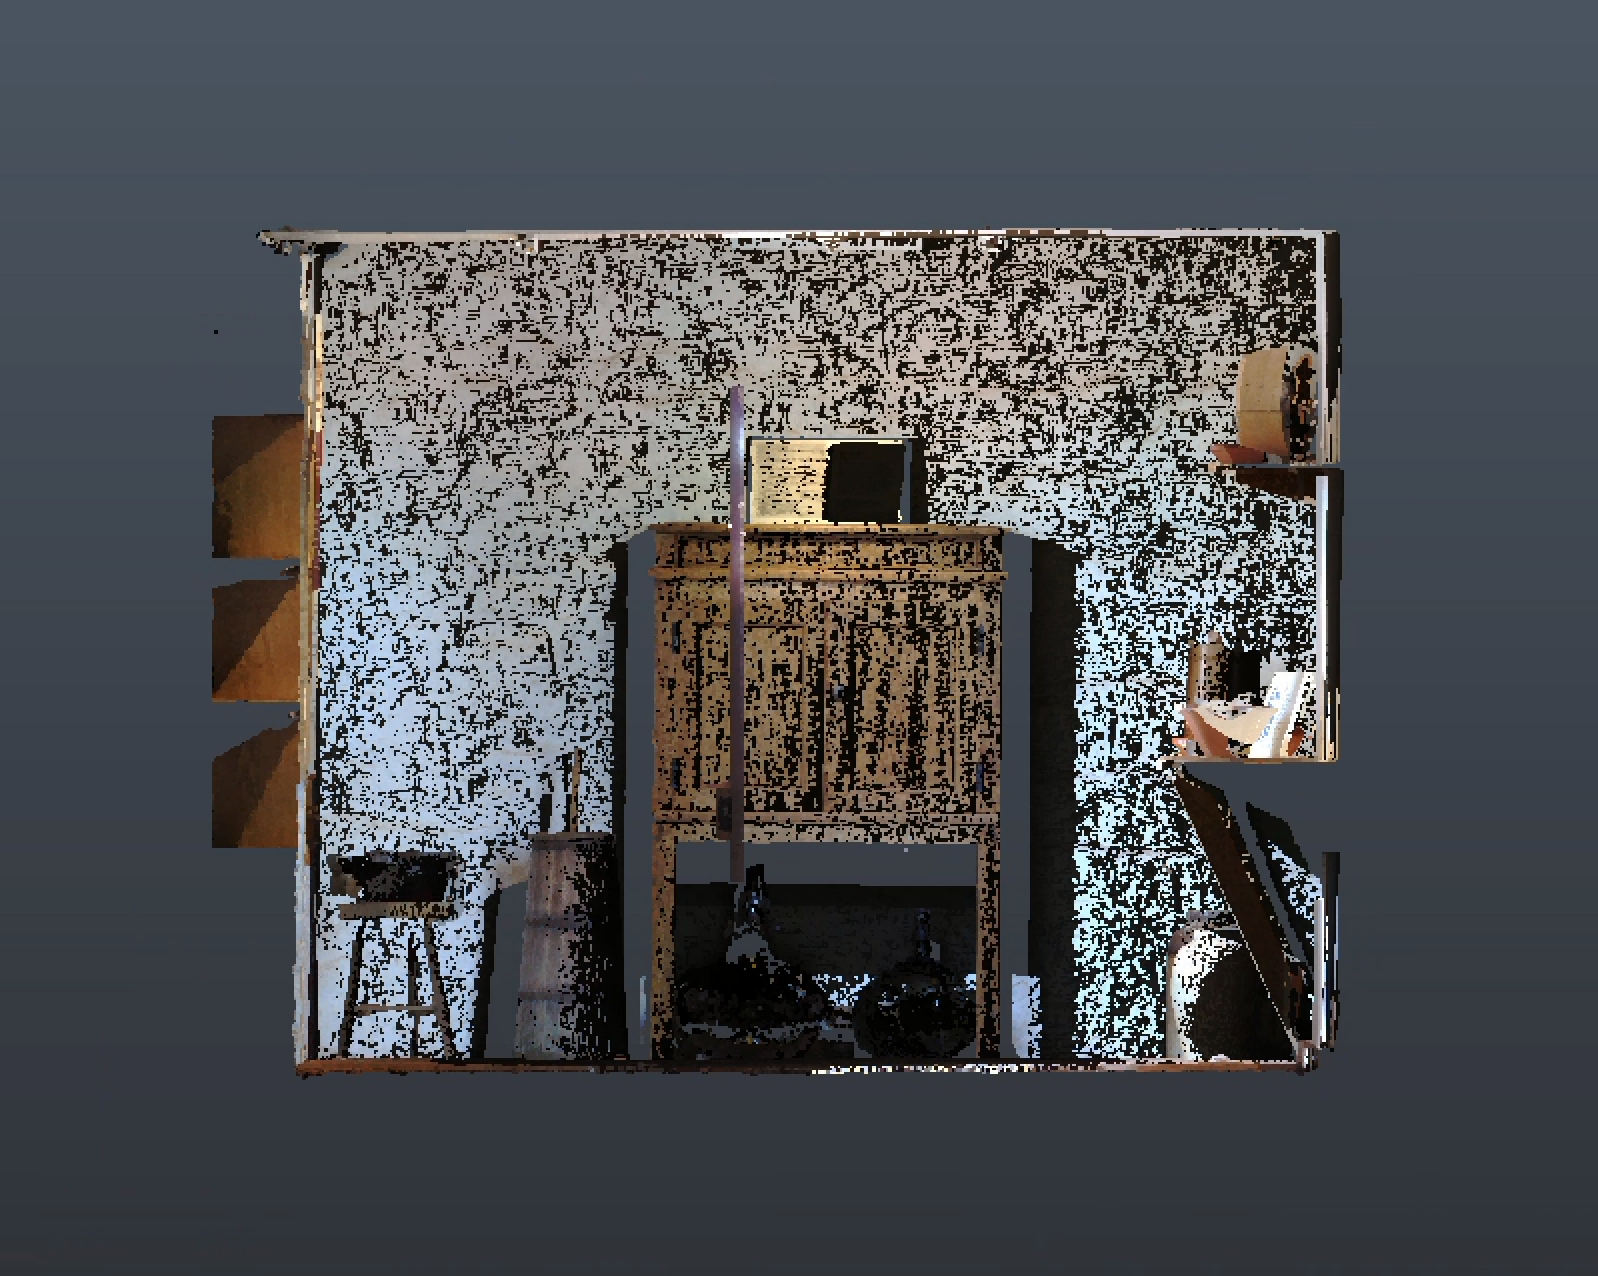
One challenge presented in registering the data from this wing was the repetitive nature of the architecture. FAROScene struggled to sort out the repetitive elements of the colonnade when putting the individual rooms into context with one another. To resolve this issue, I ended up creating an area I called the bridge, which connected the eastern and western sections of the plan.
The central bridge section connecting the eastern and western halves of the wing
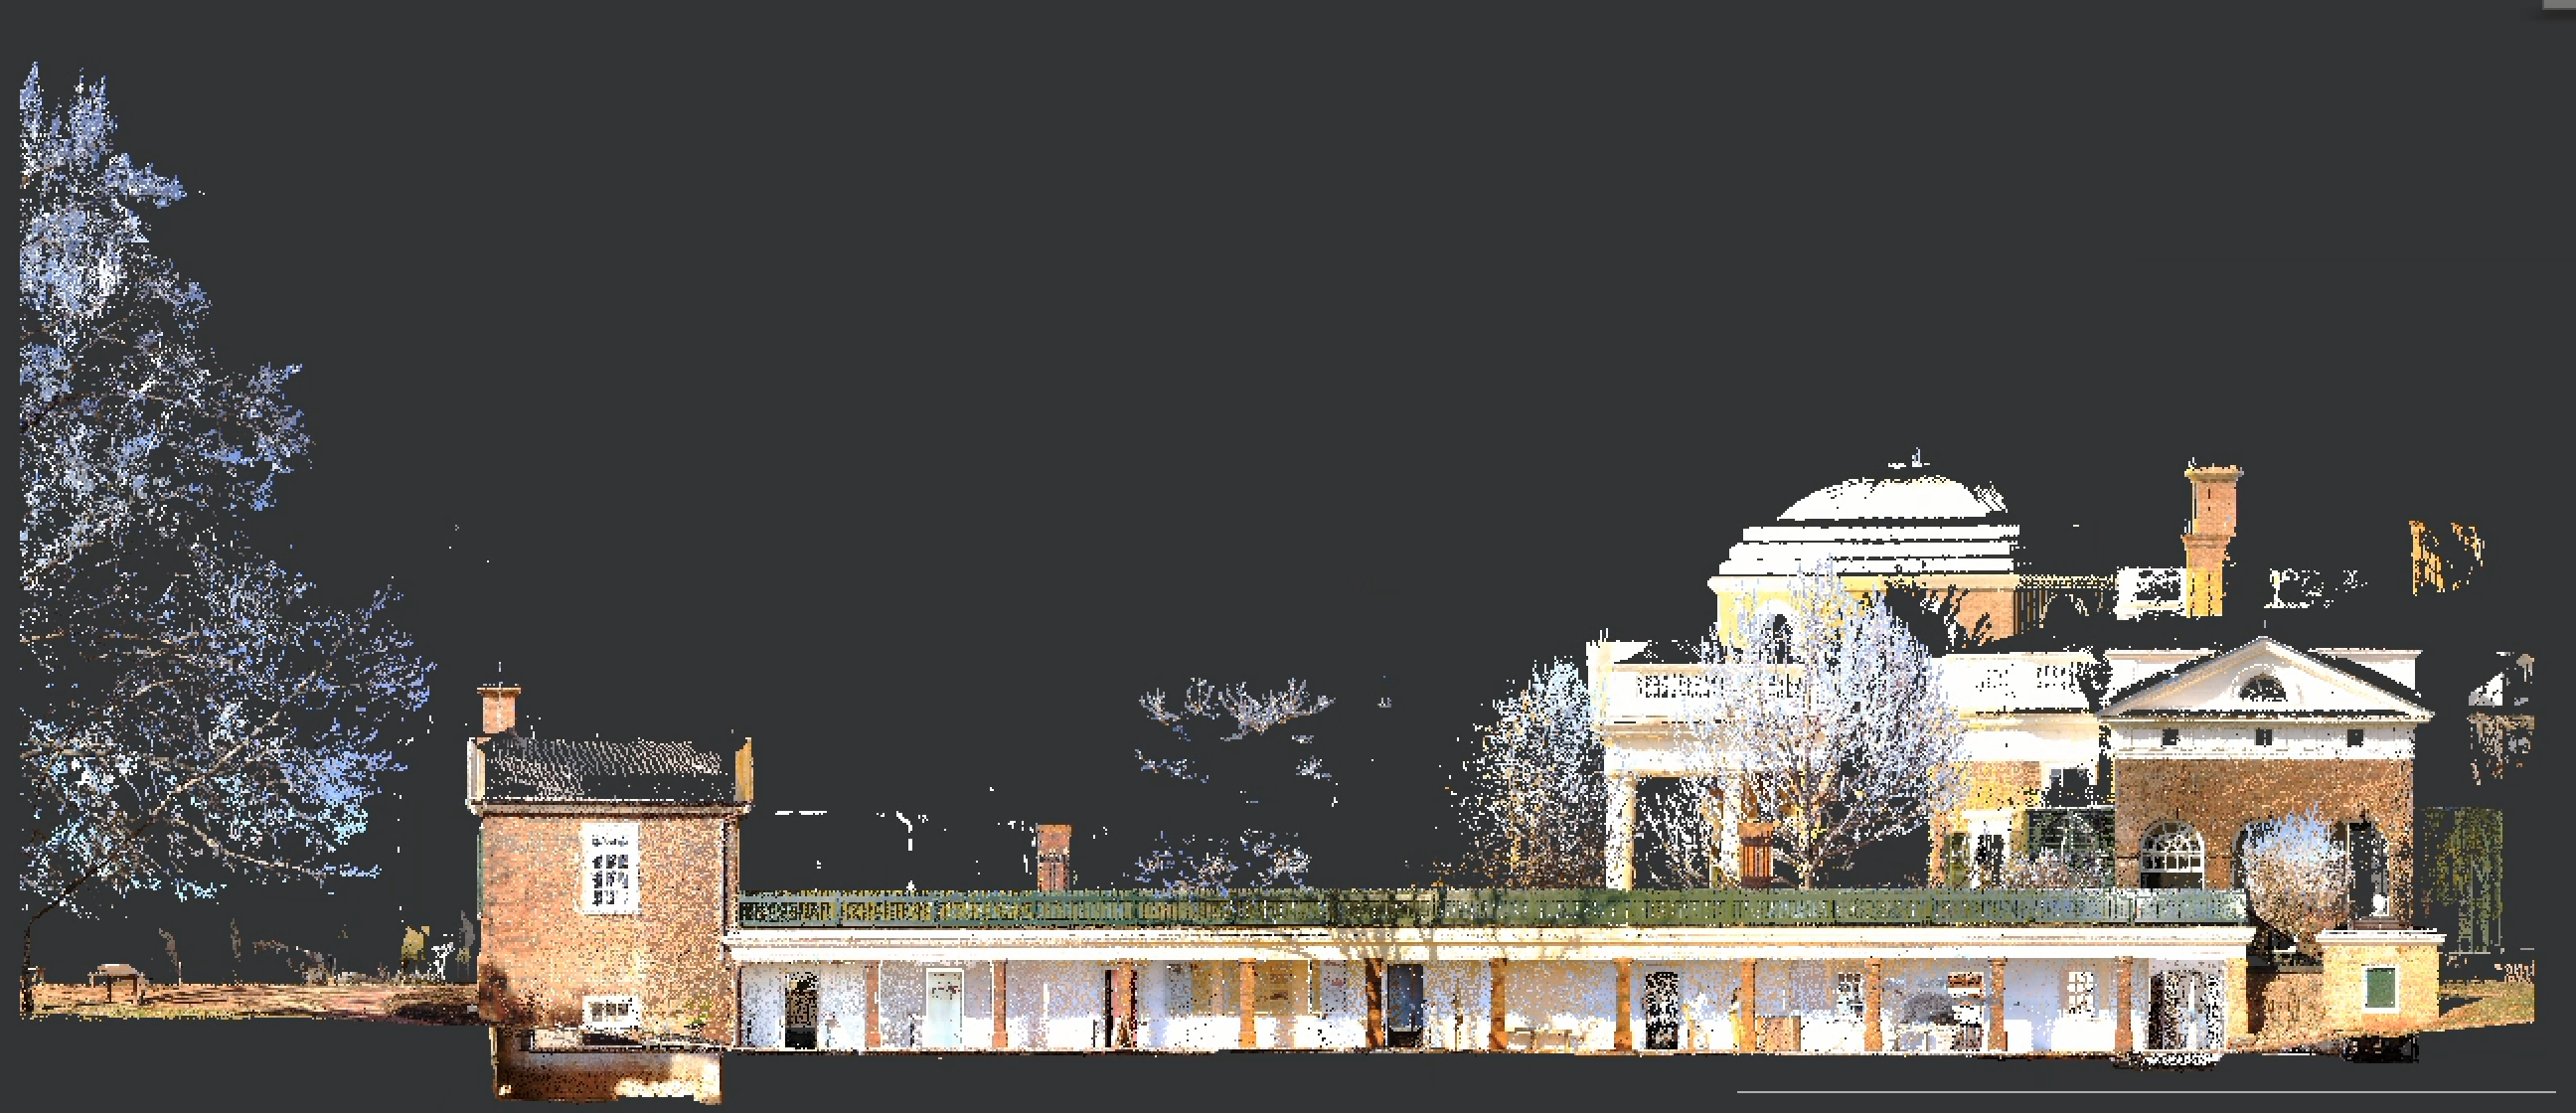
This project overview map shows the repeated columns along the exterior walkway that proved so problematic.
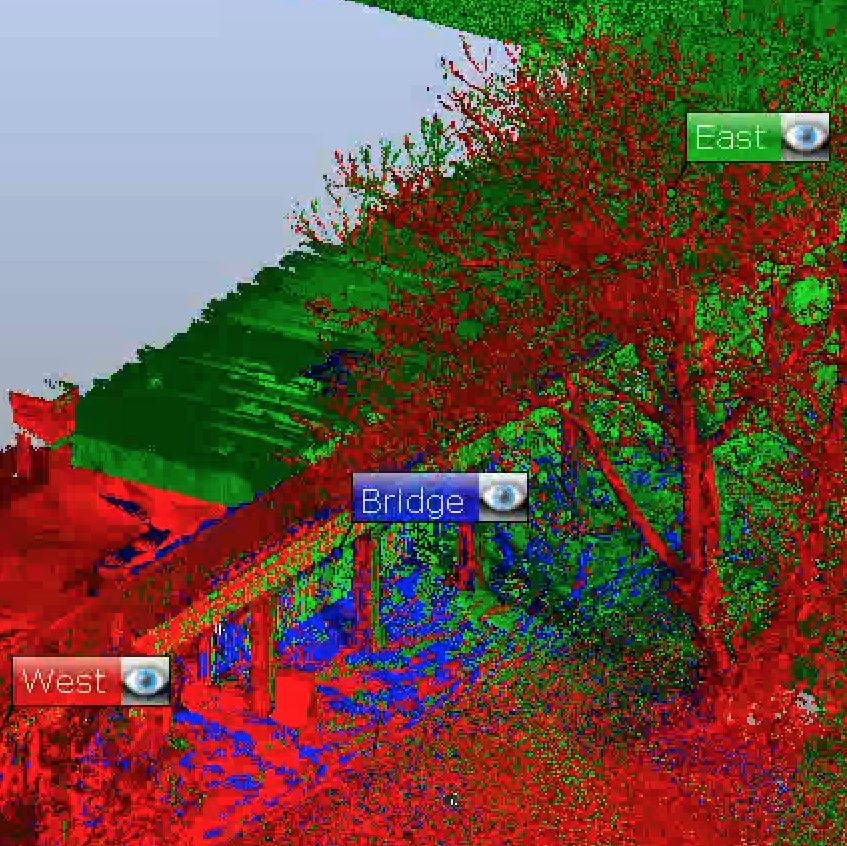
However, the largest challenge in registering this portion of the house was combining the two levels. Without a staircase connecting them, the only common features were in the landscape. Because the landscape was not the focus of this scanning data, there wasn’t always enough detail to connect them here.
It proved necessary to add several scans from around the main house in order to have enough overlapping information. The resulting dataset contained all the information about the south dependency wing, but also included more data than I had originally intended to use.
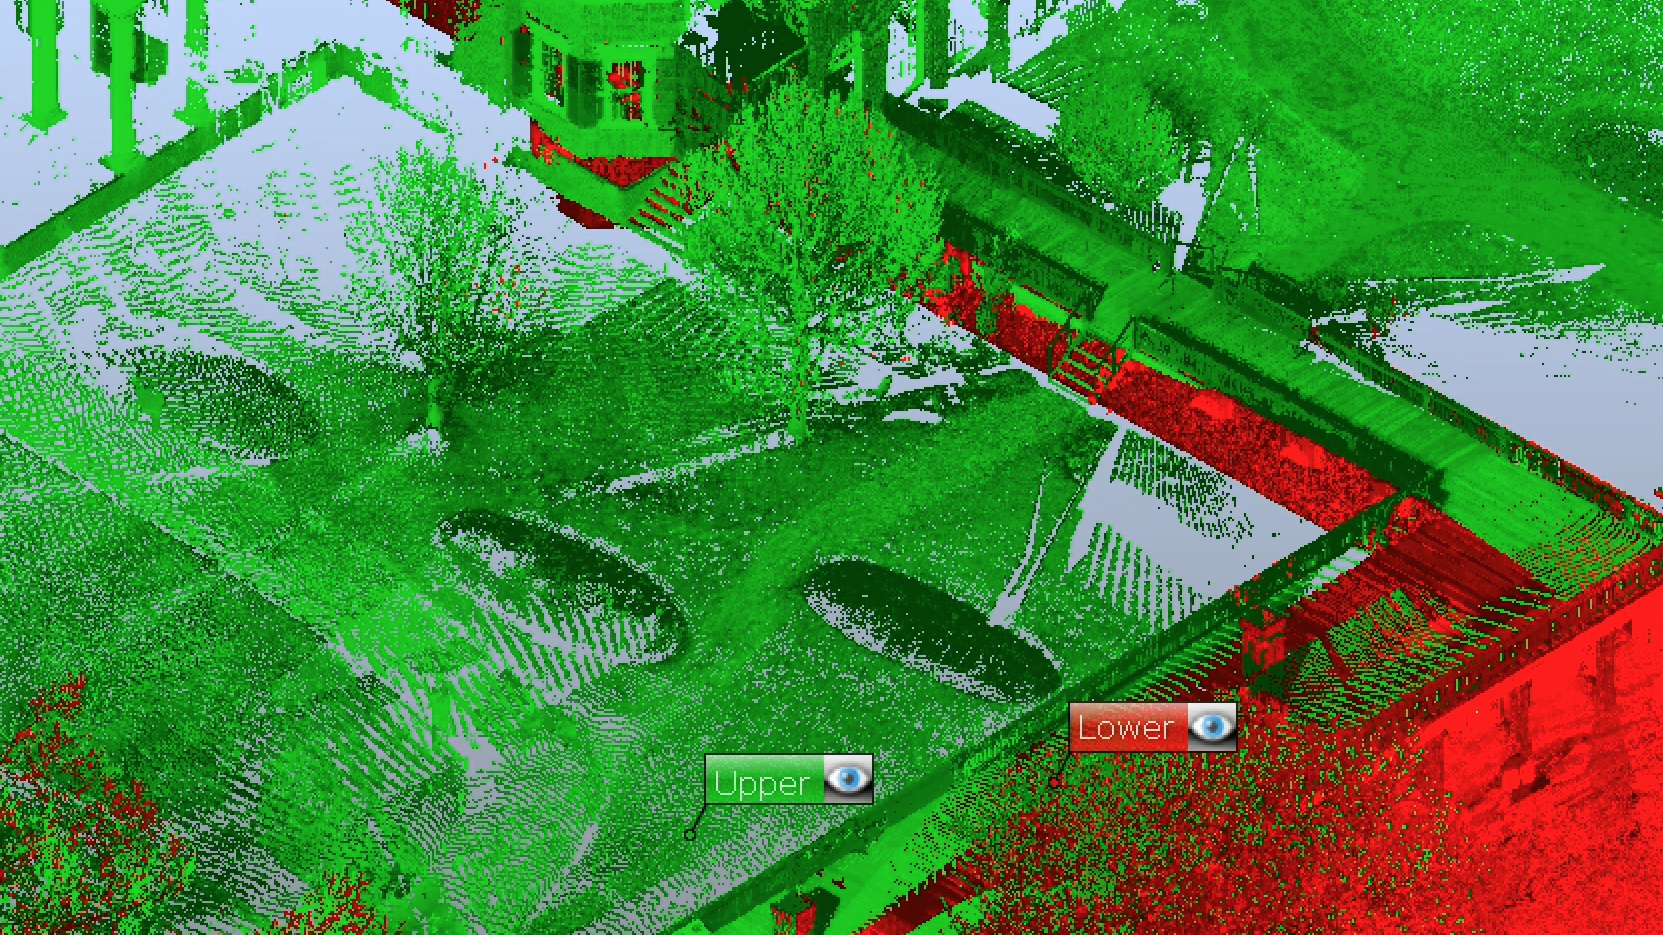
I had to include extra data around the wing to connect the two levels together
visualizing
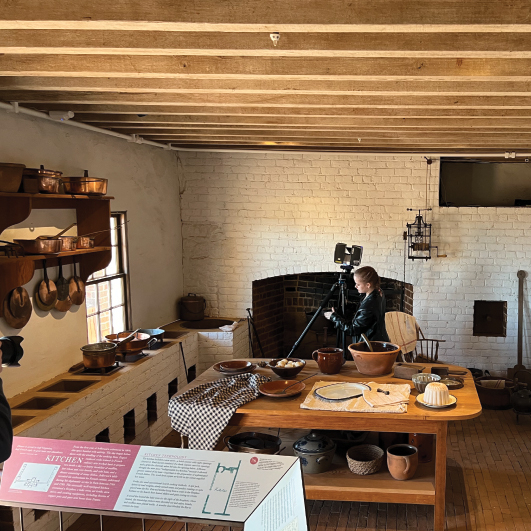
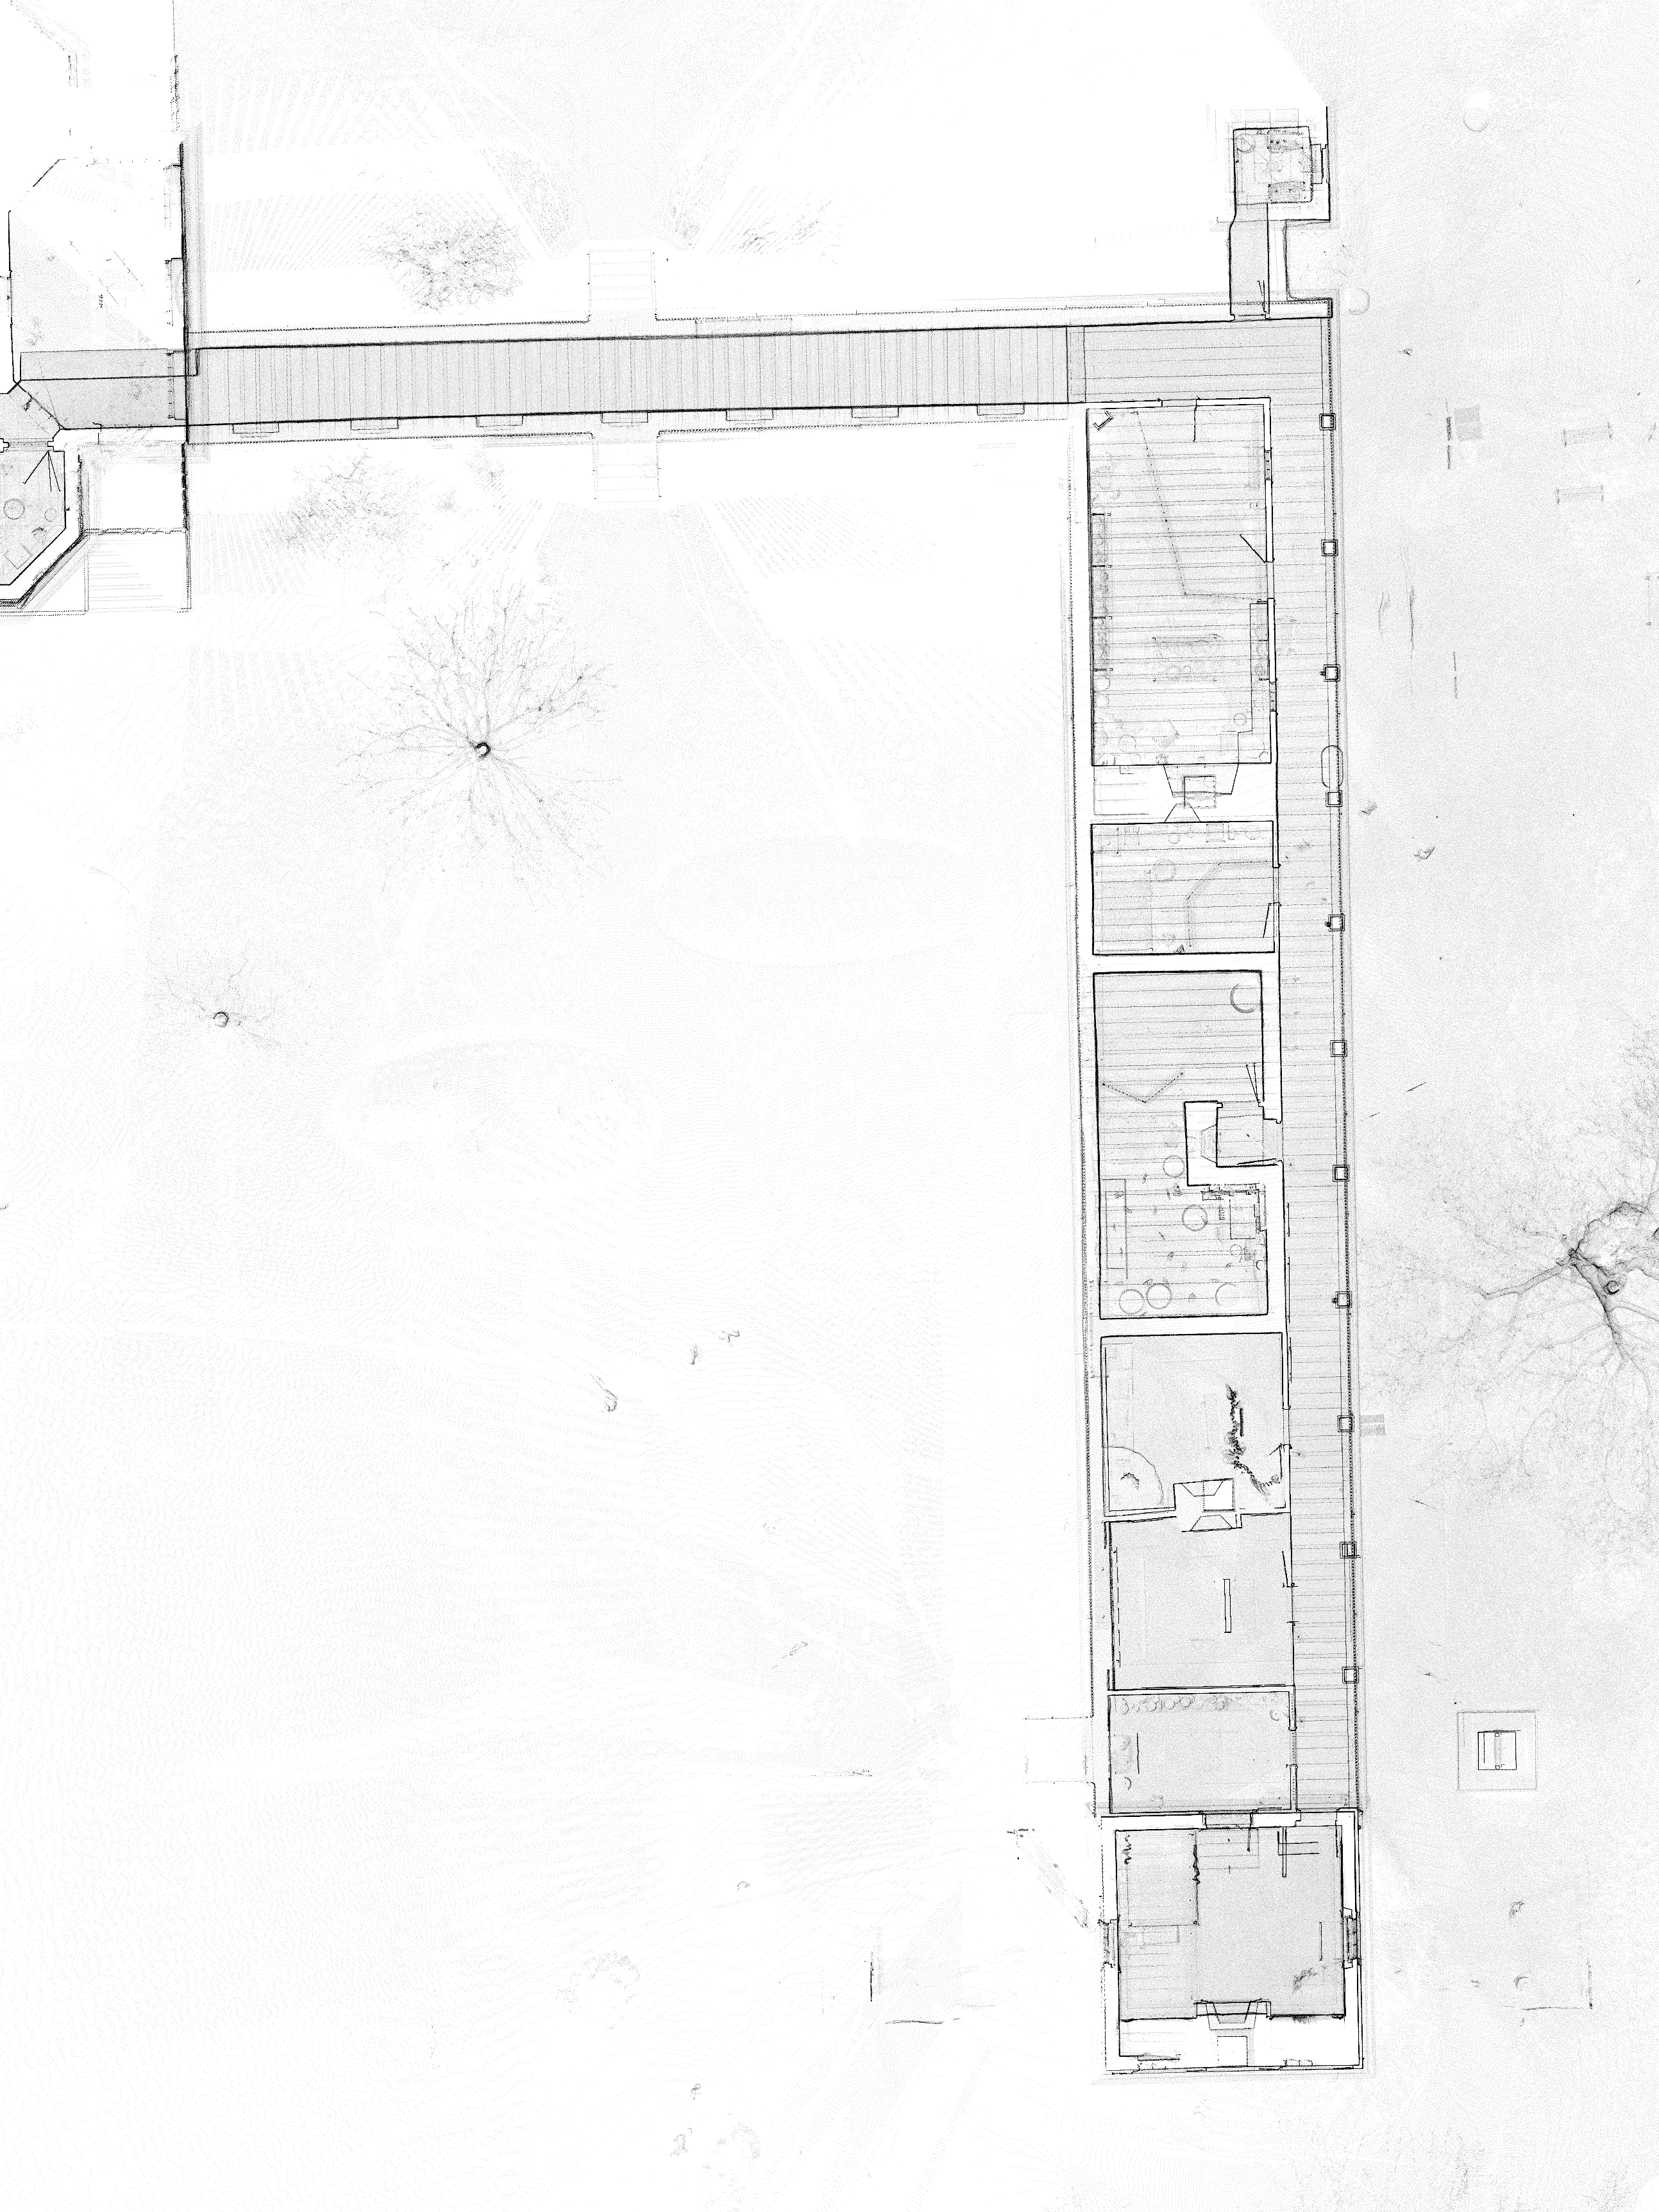
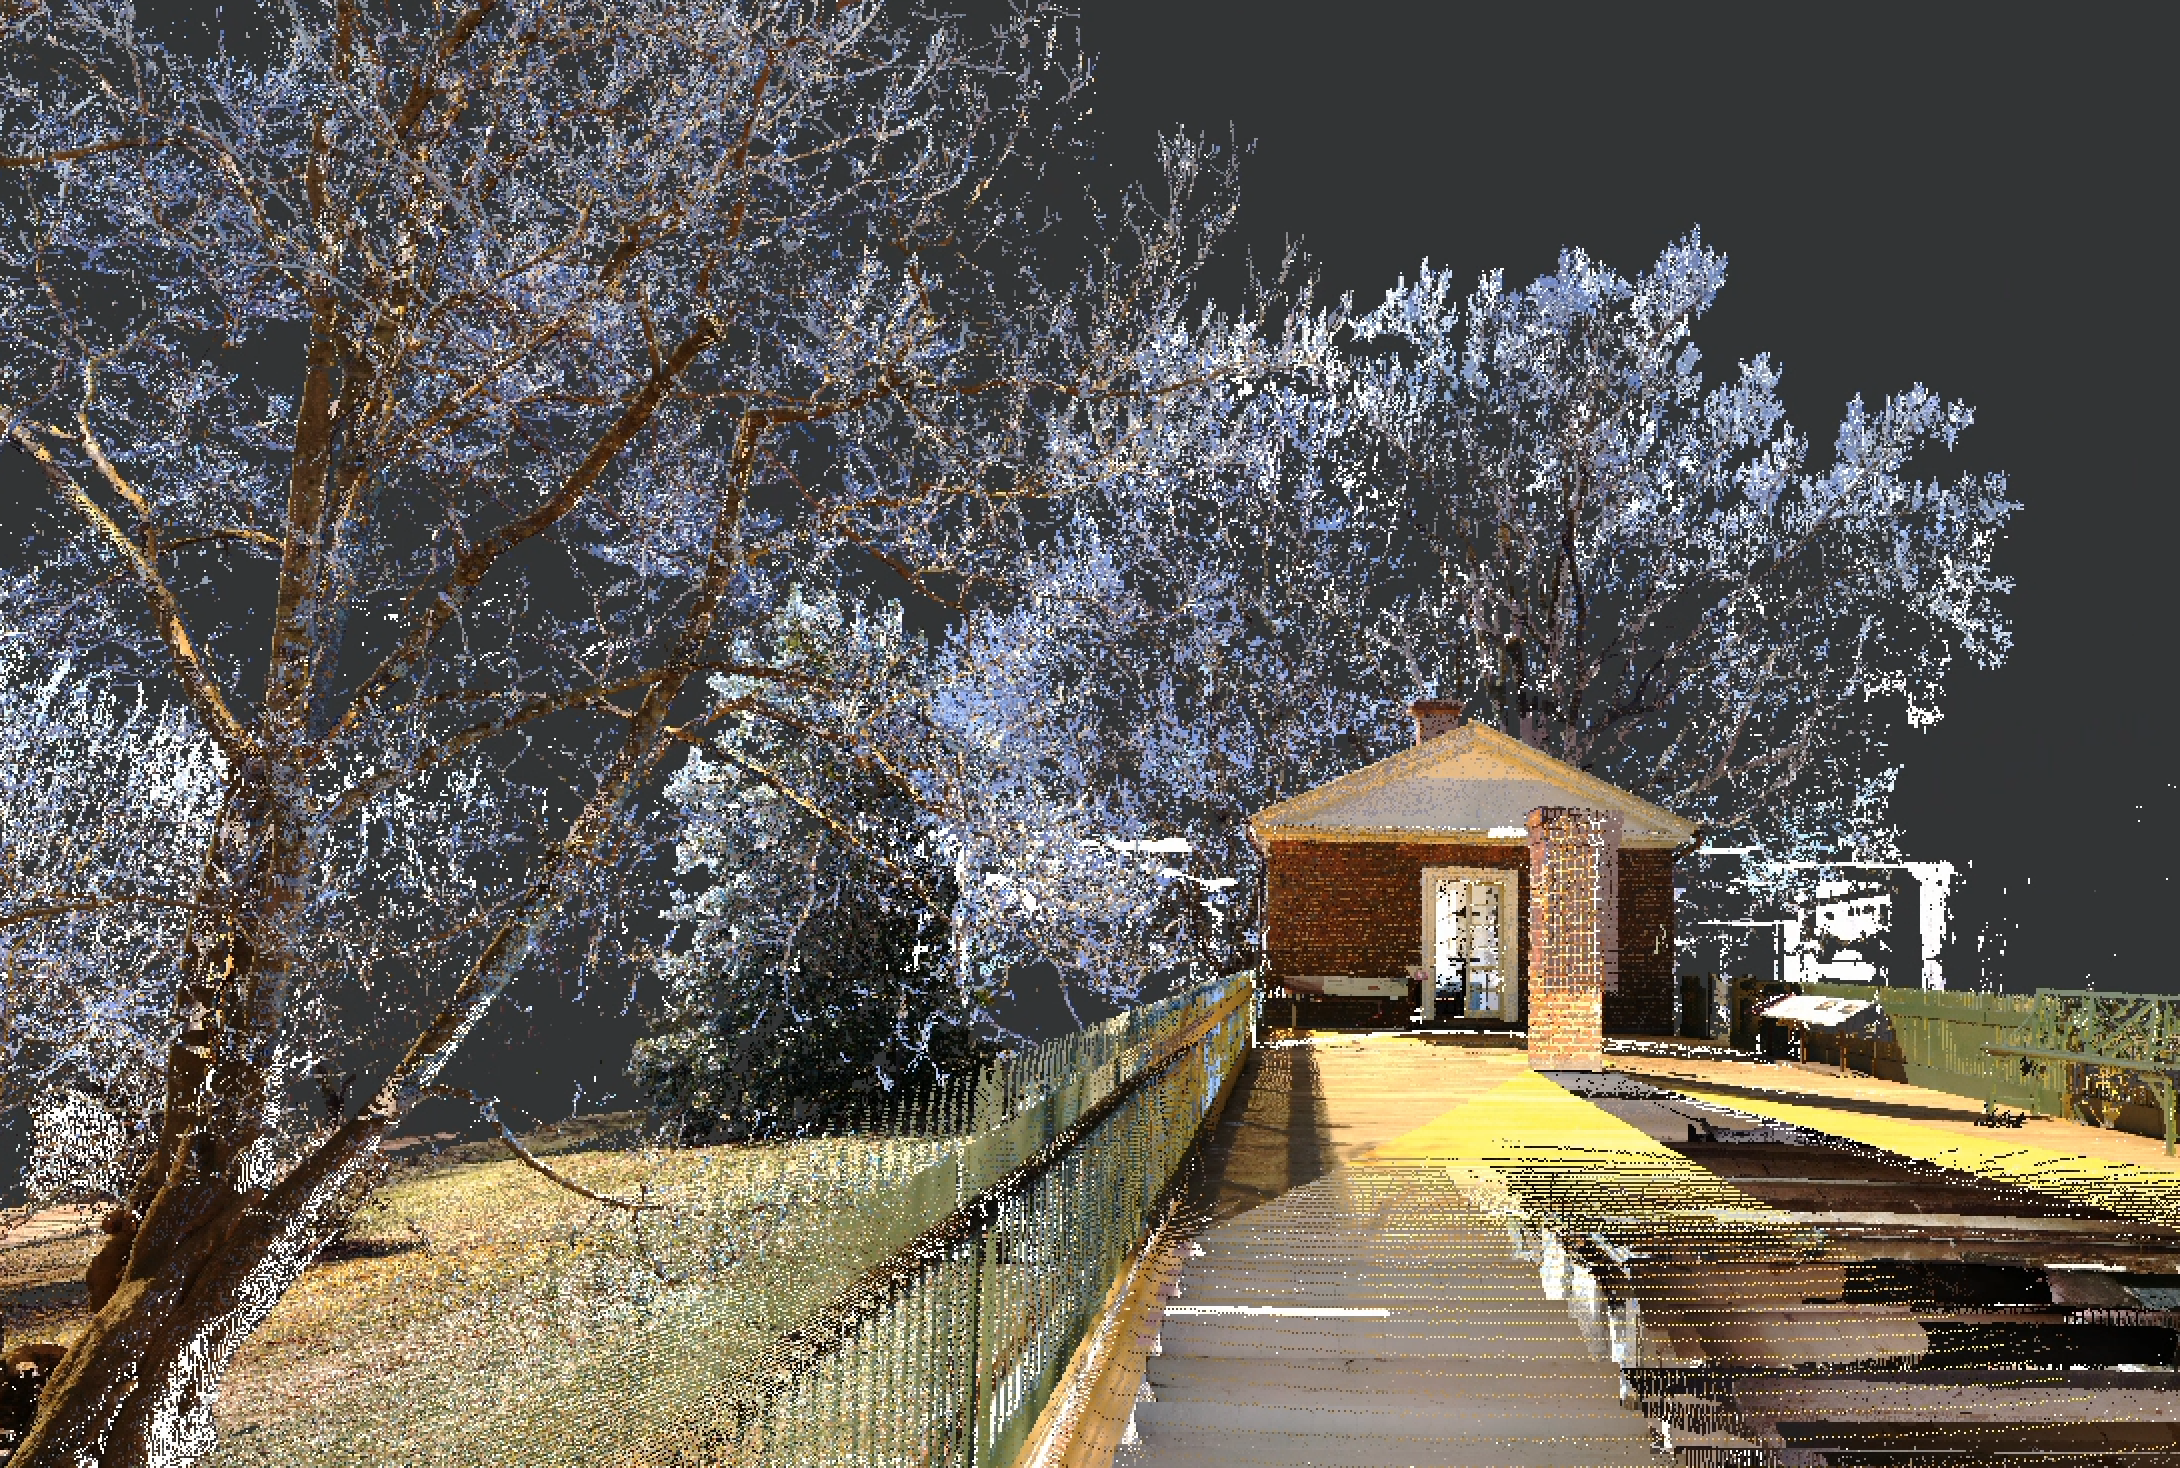
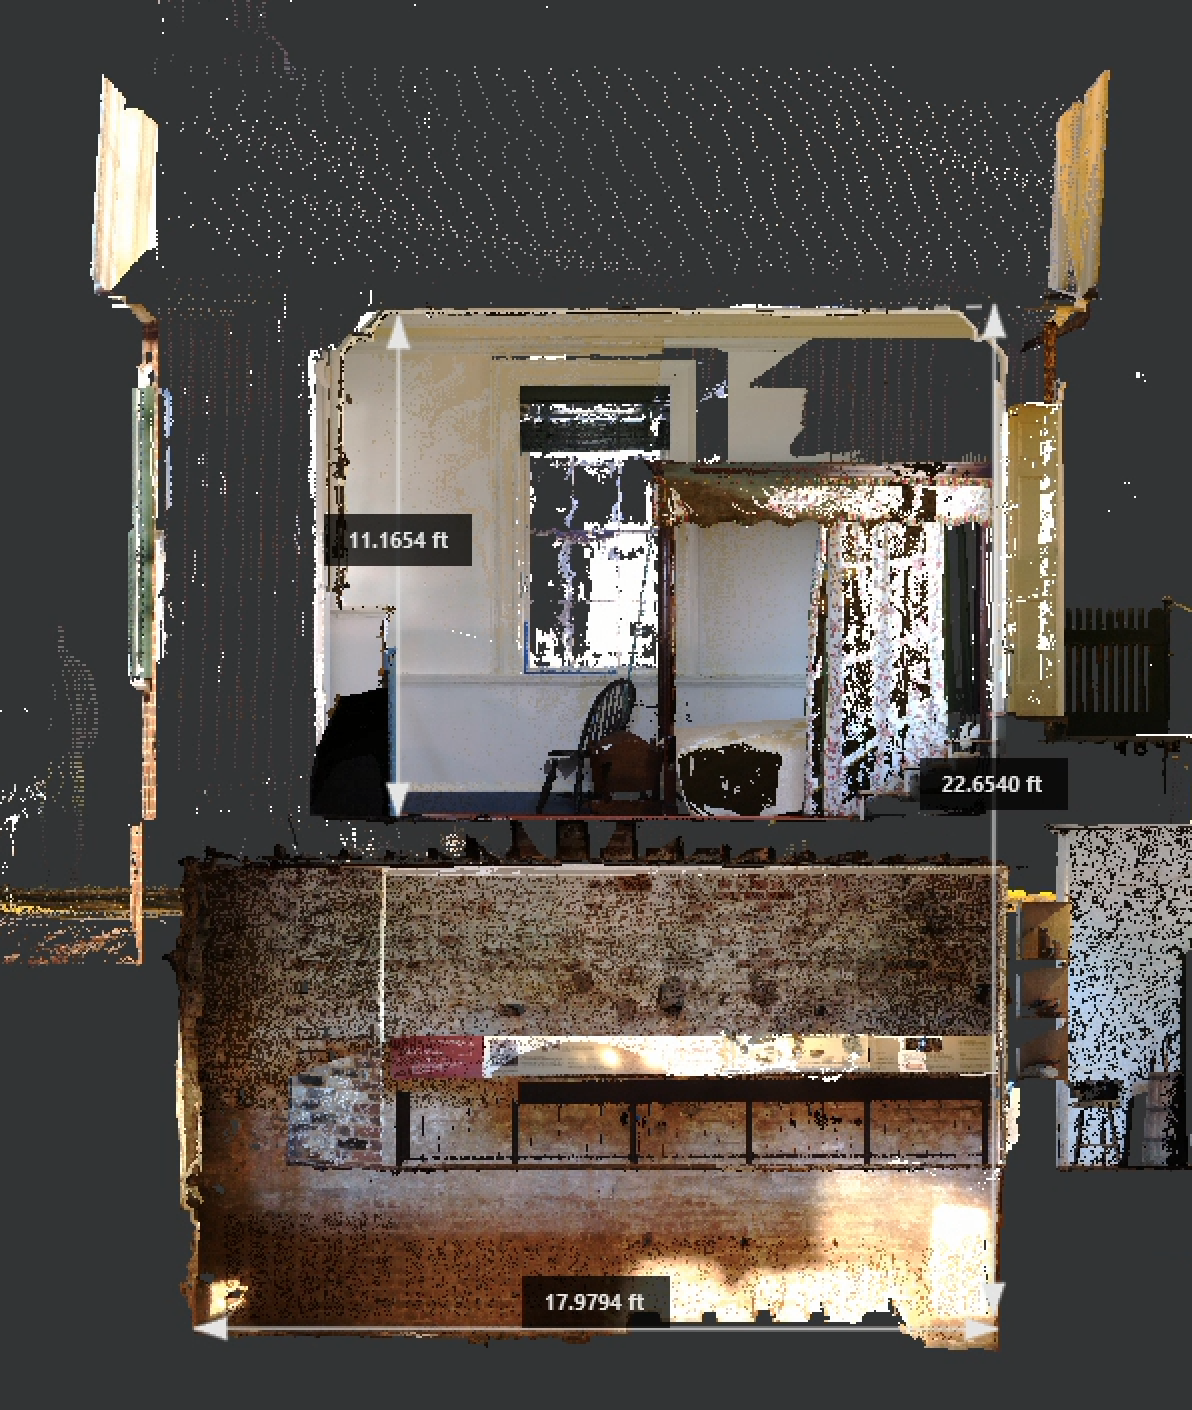
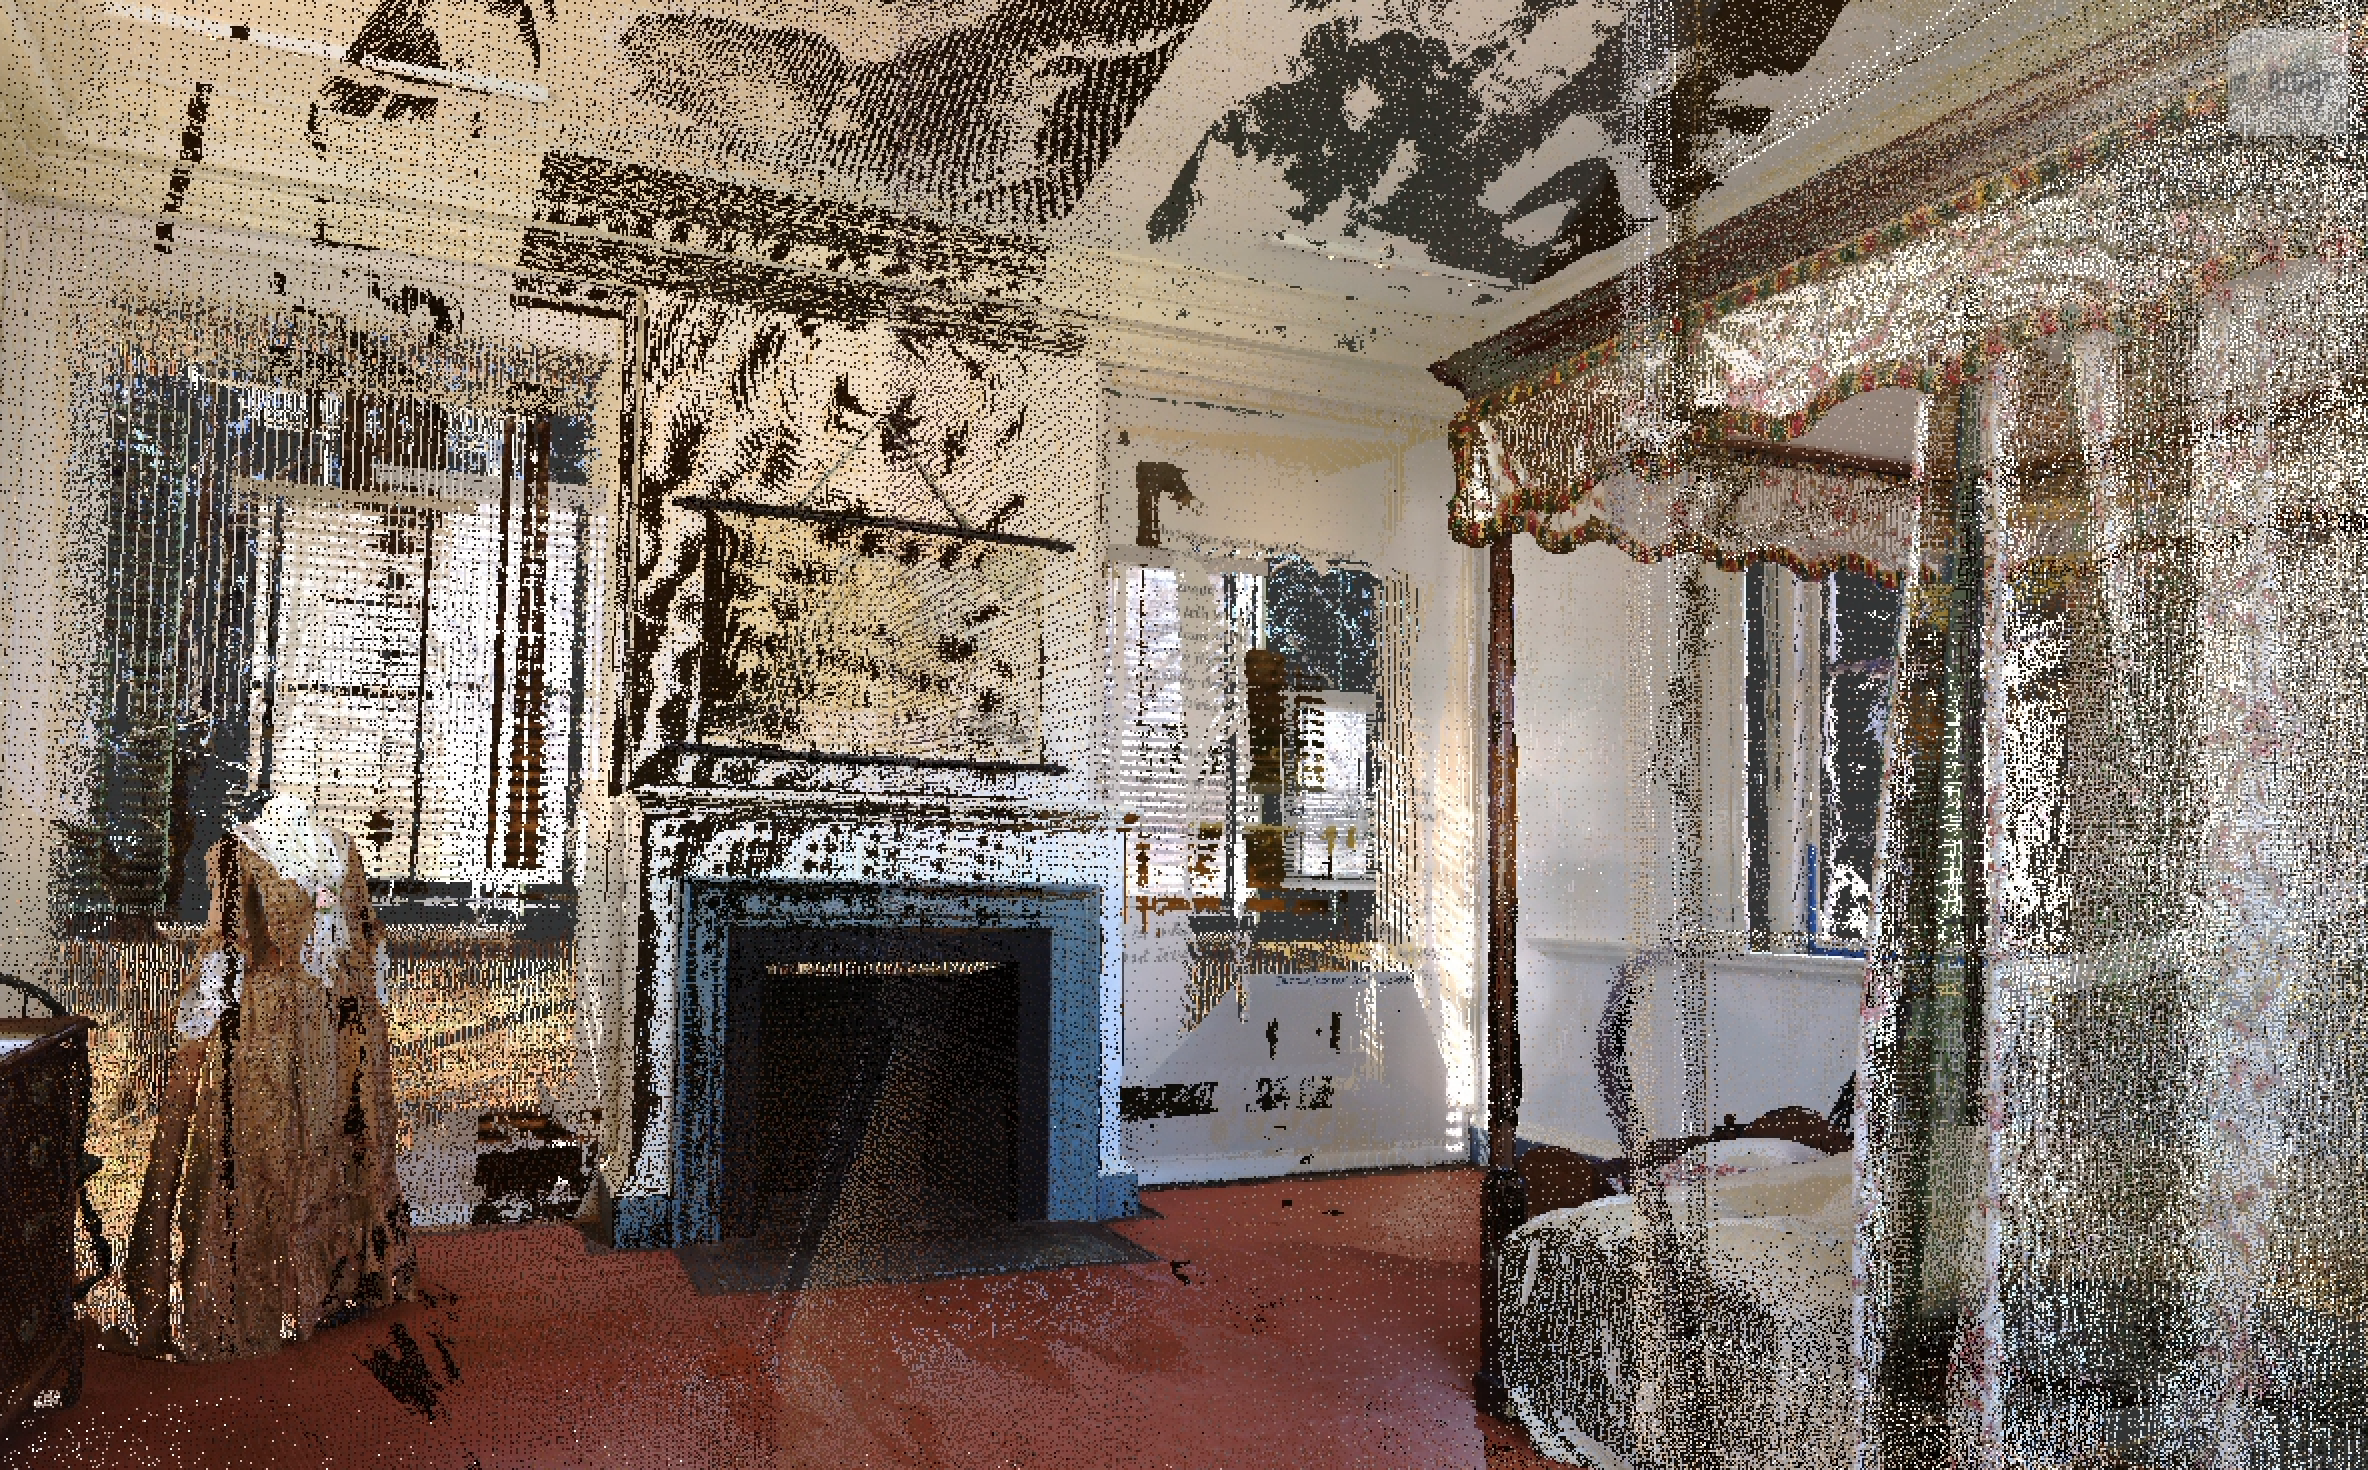
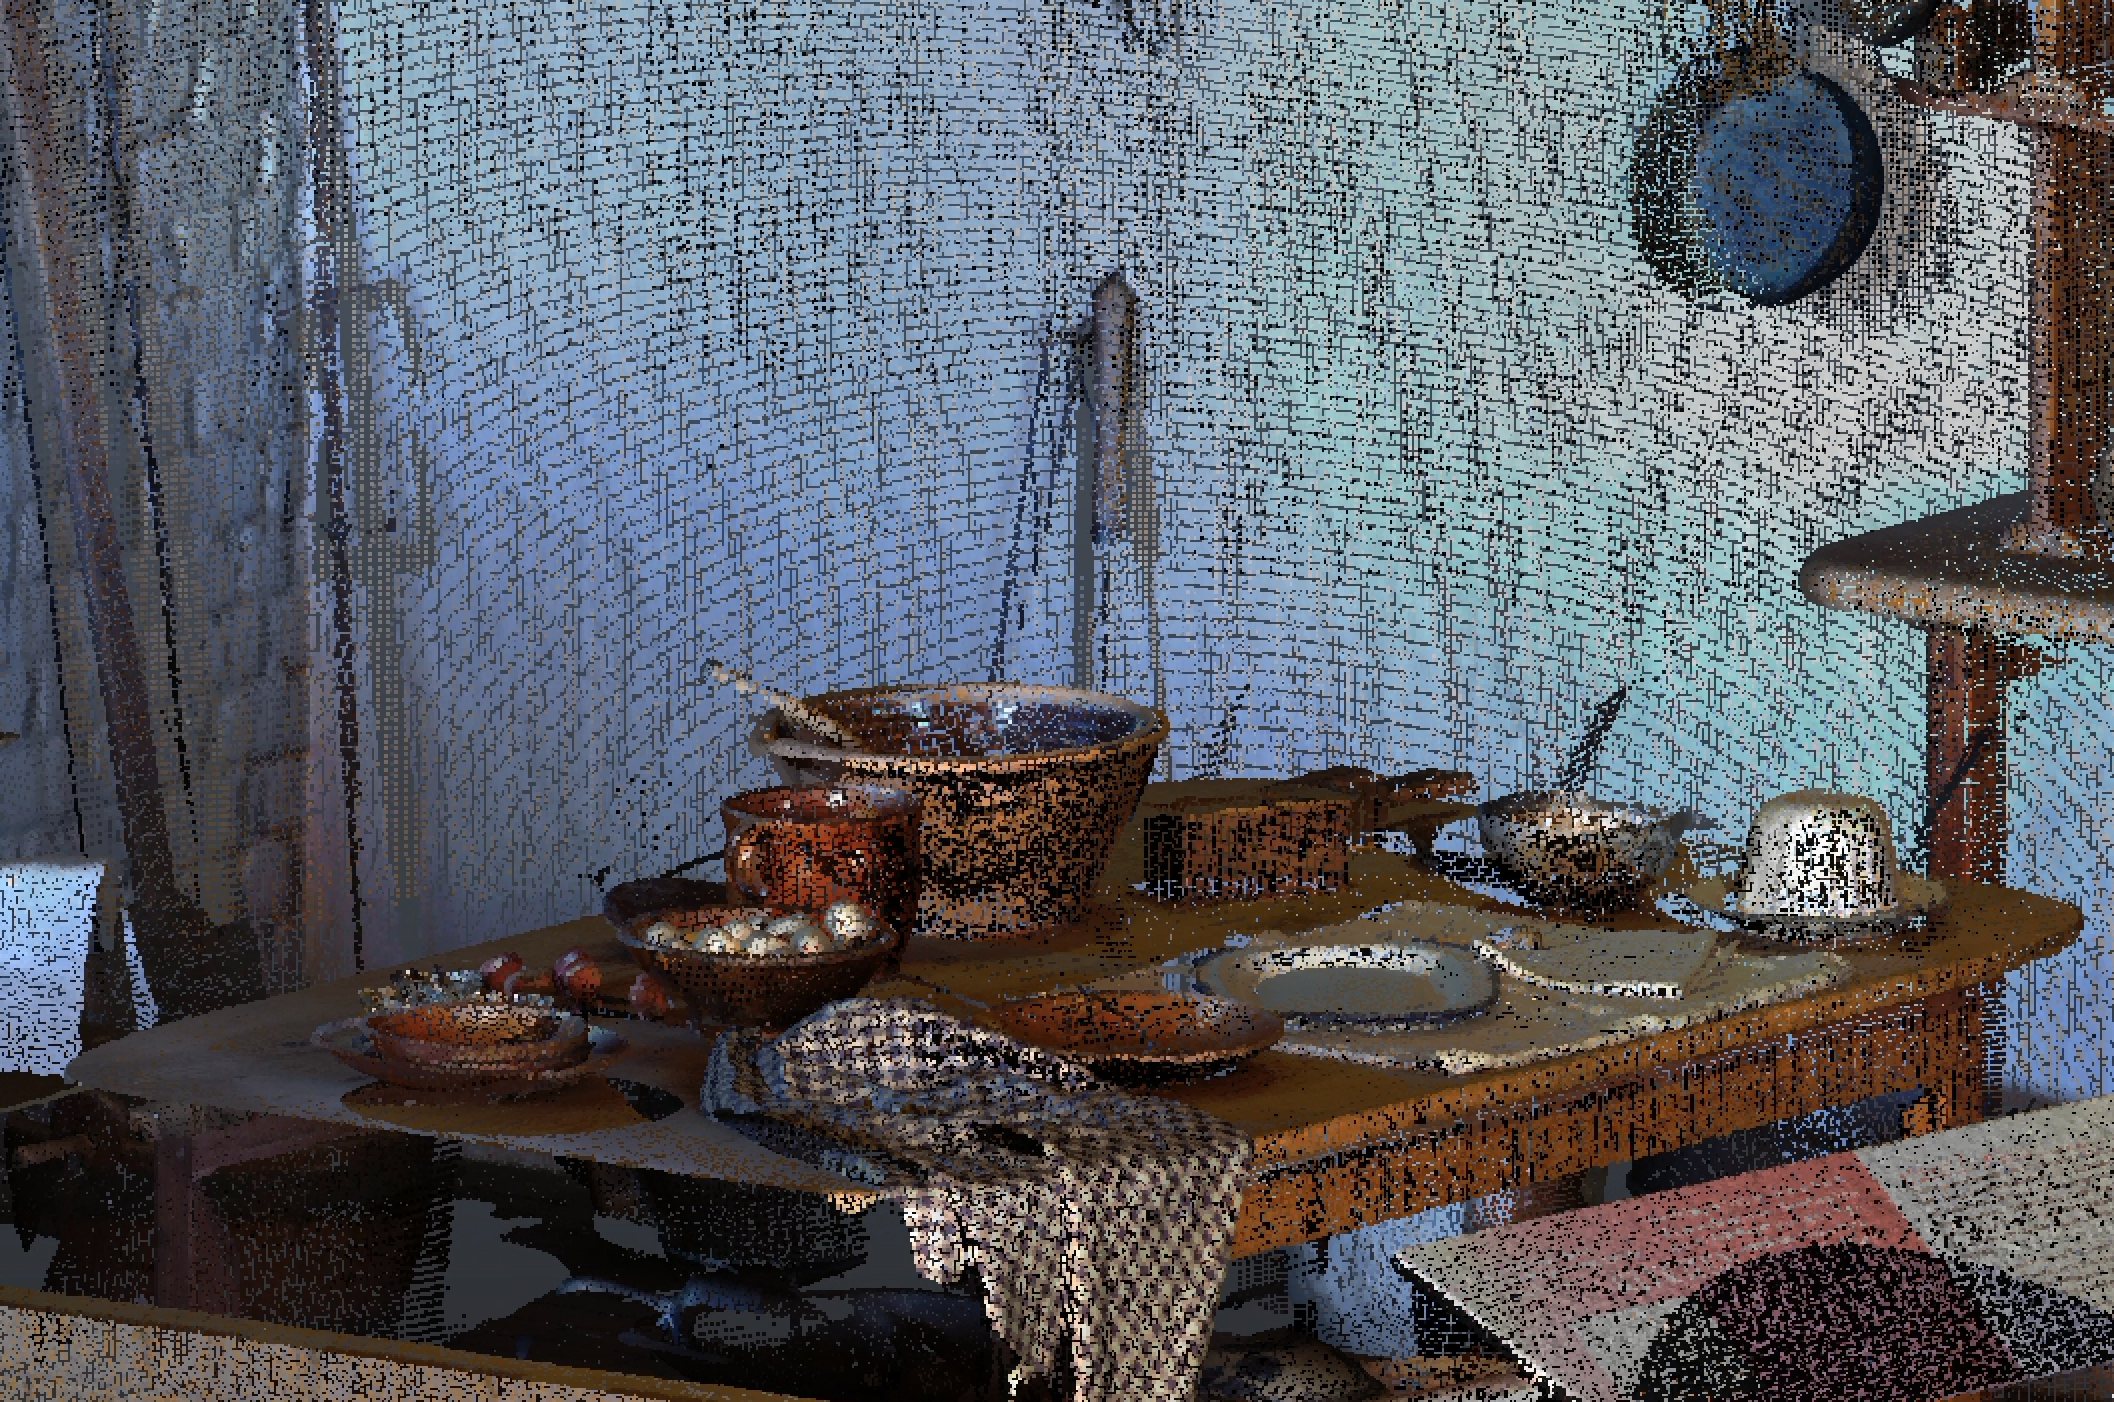
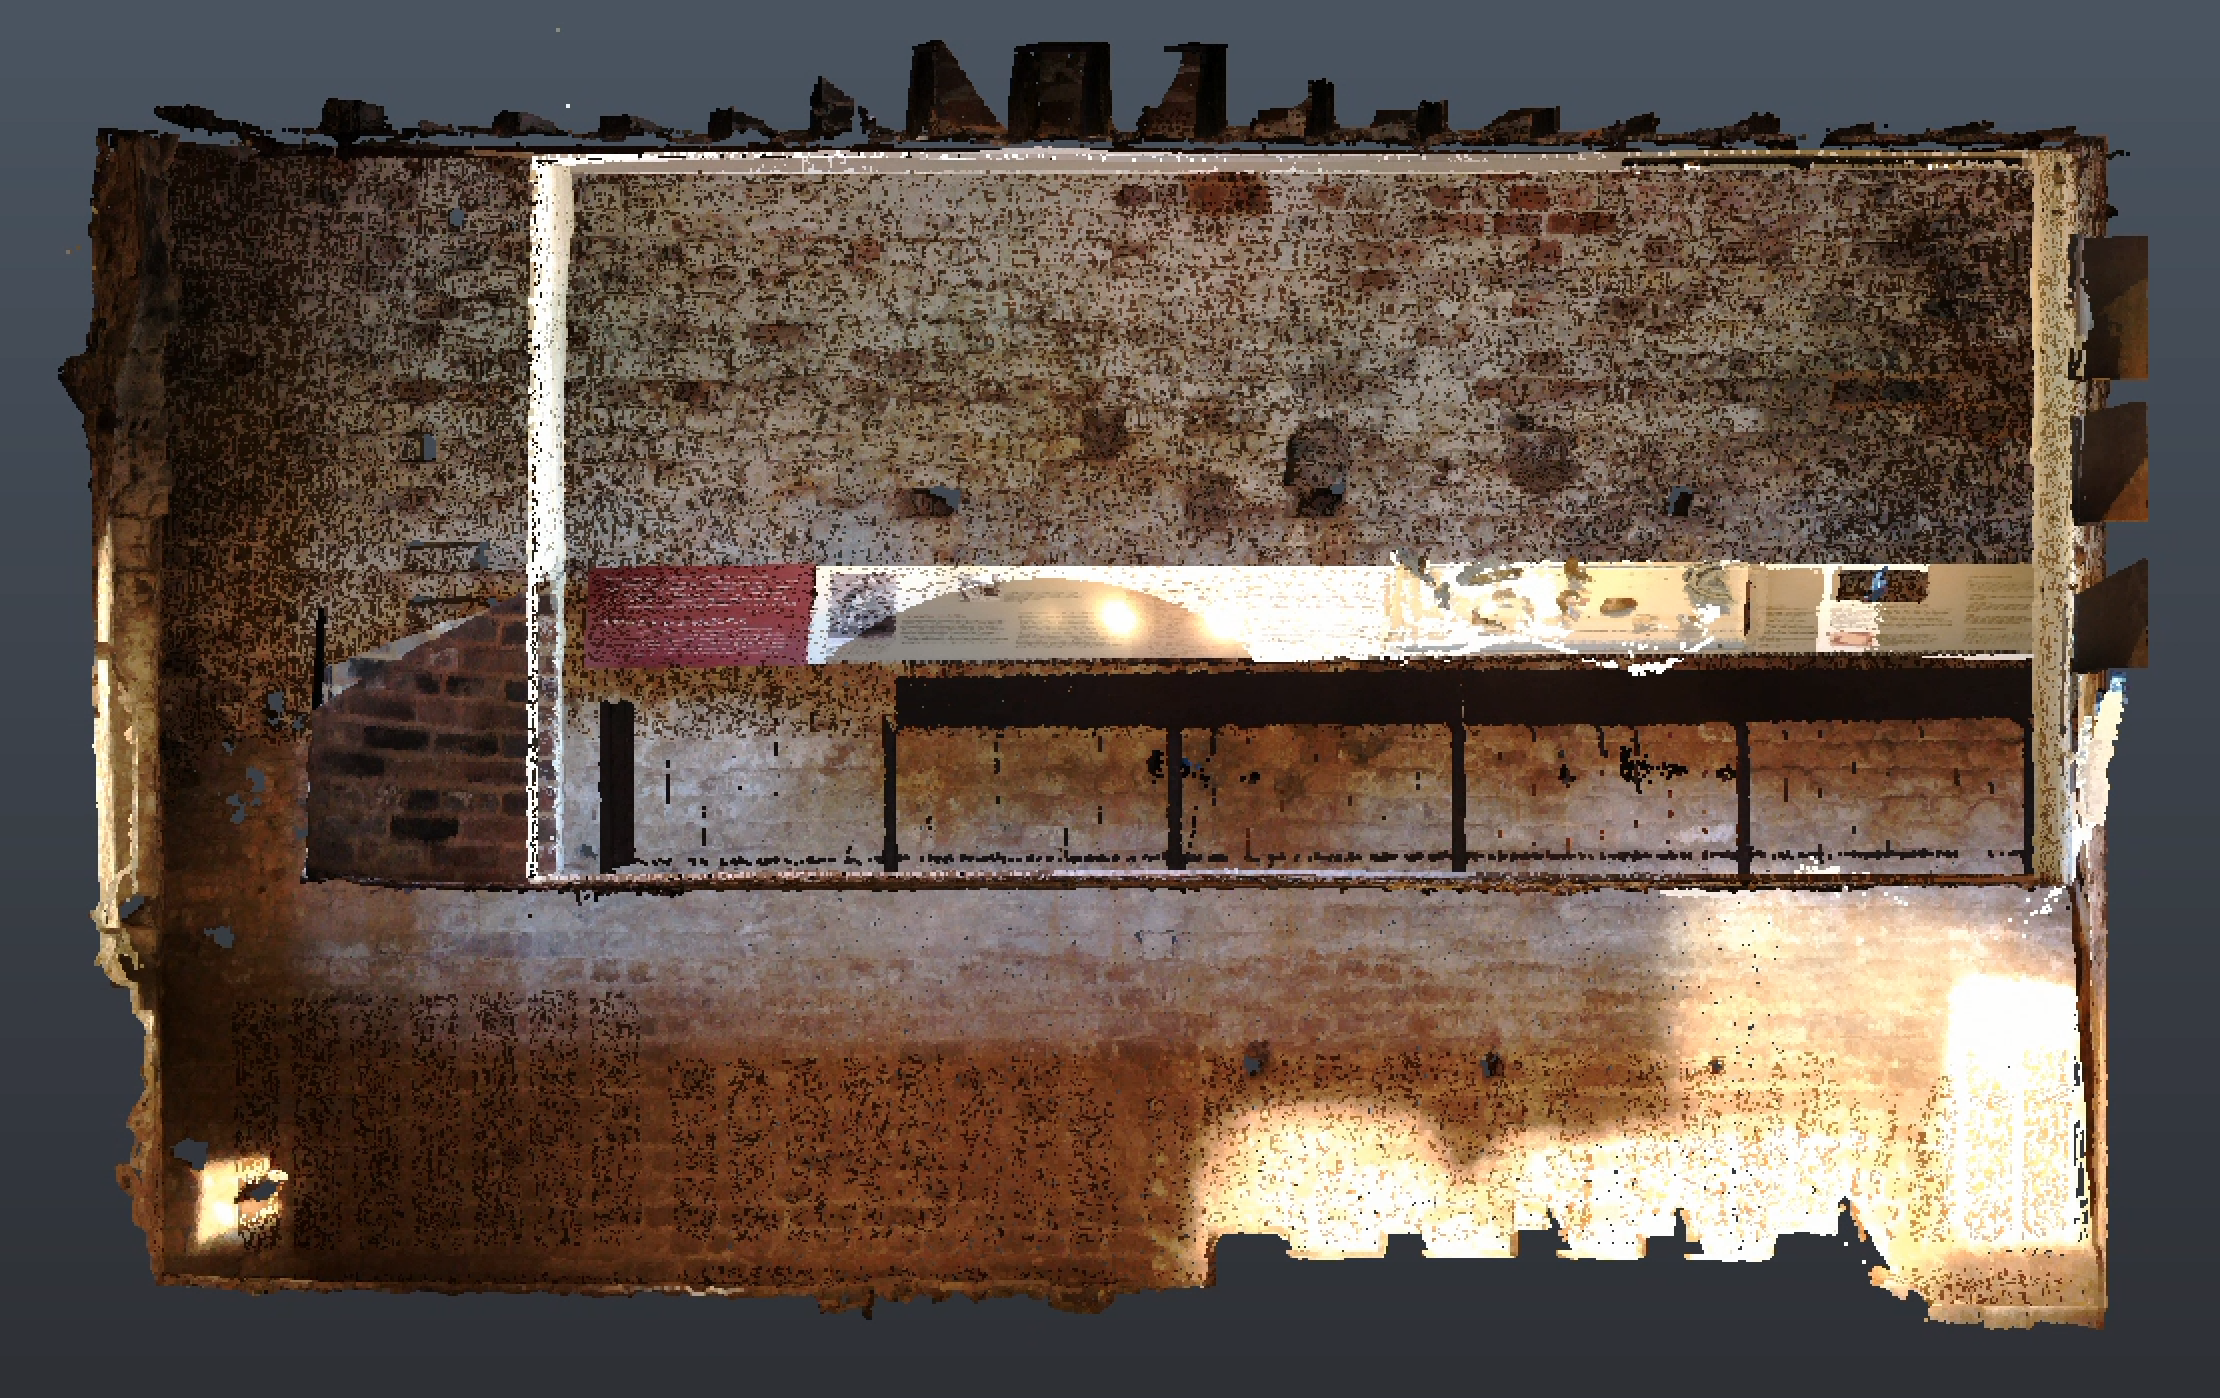
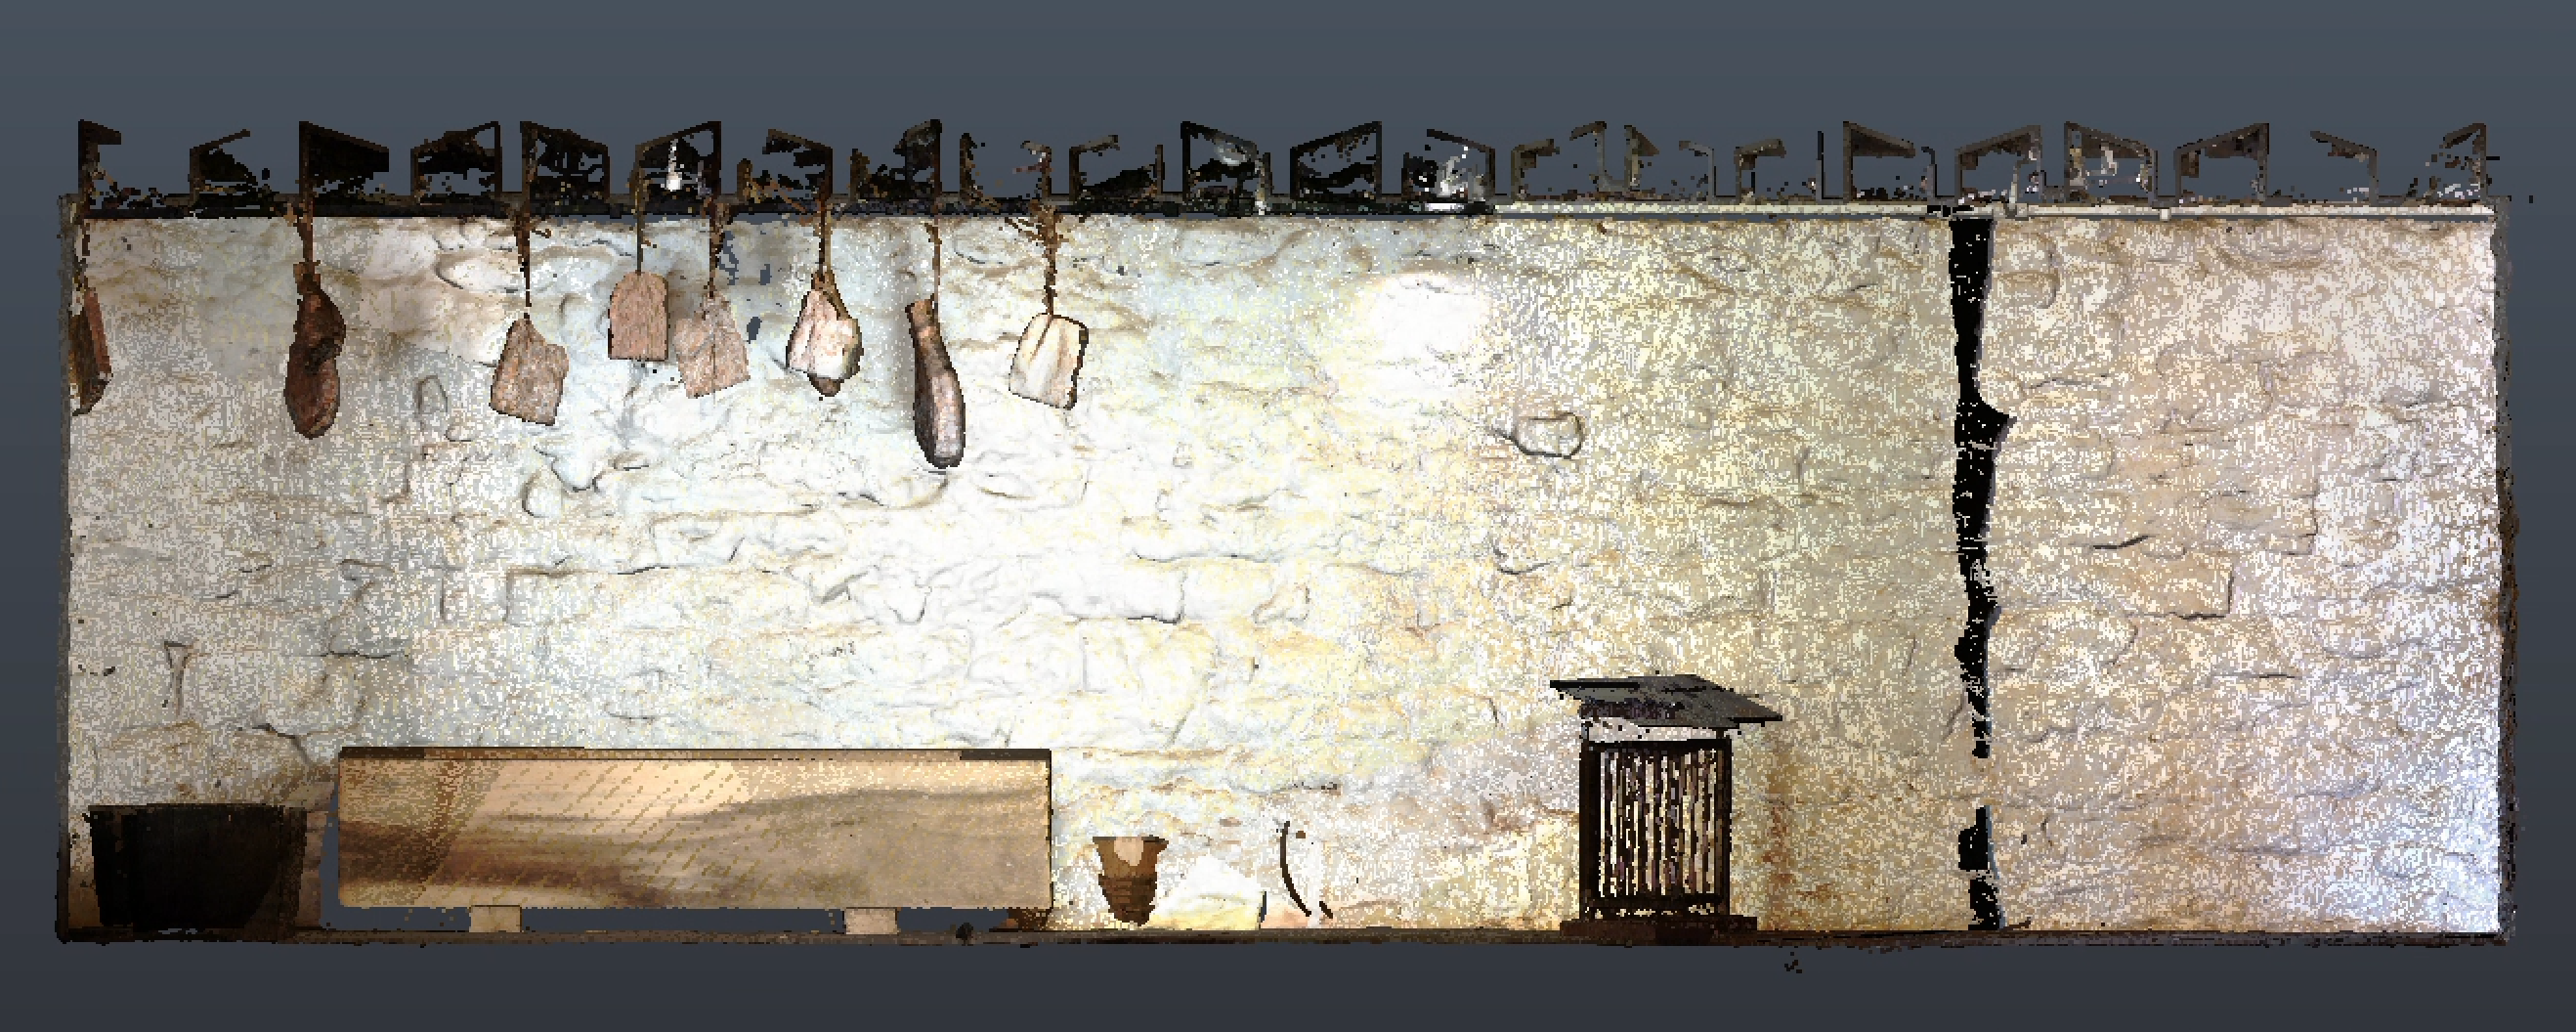
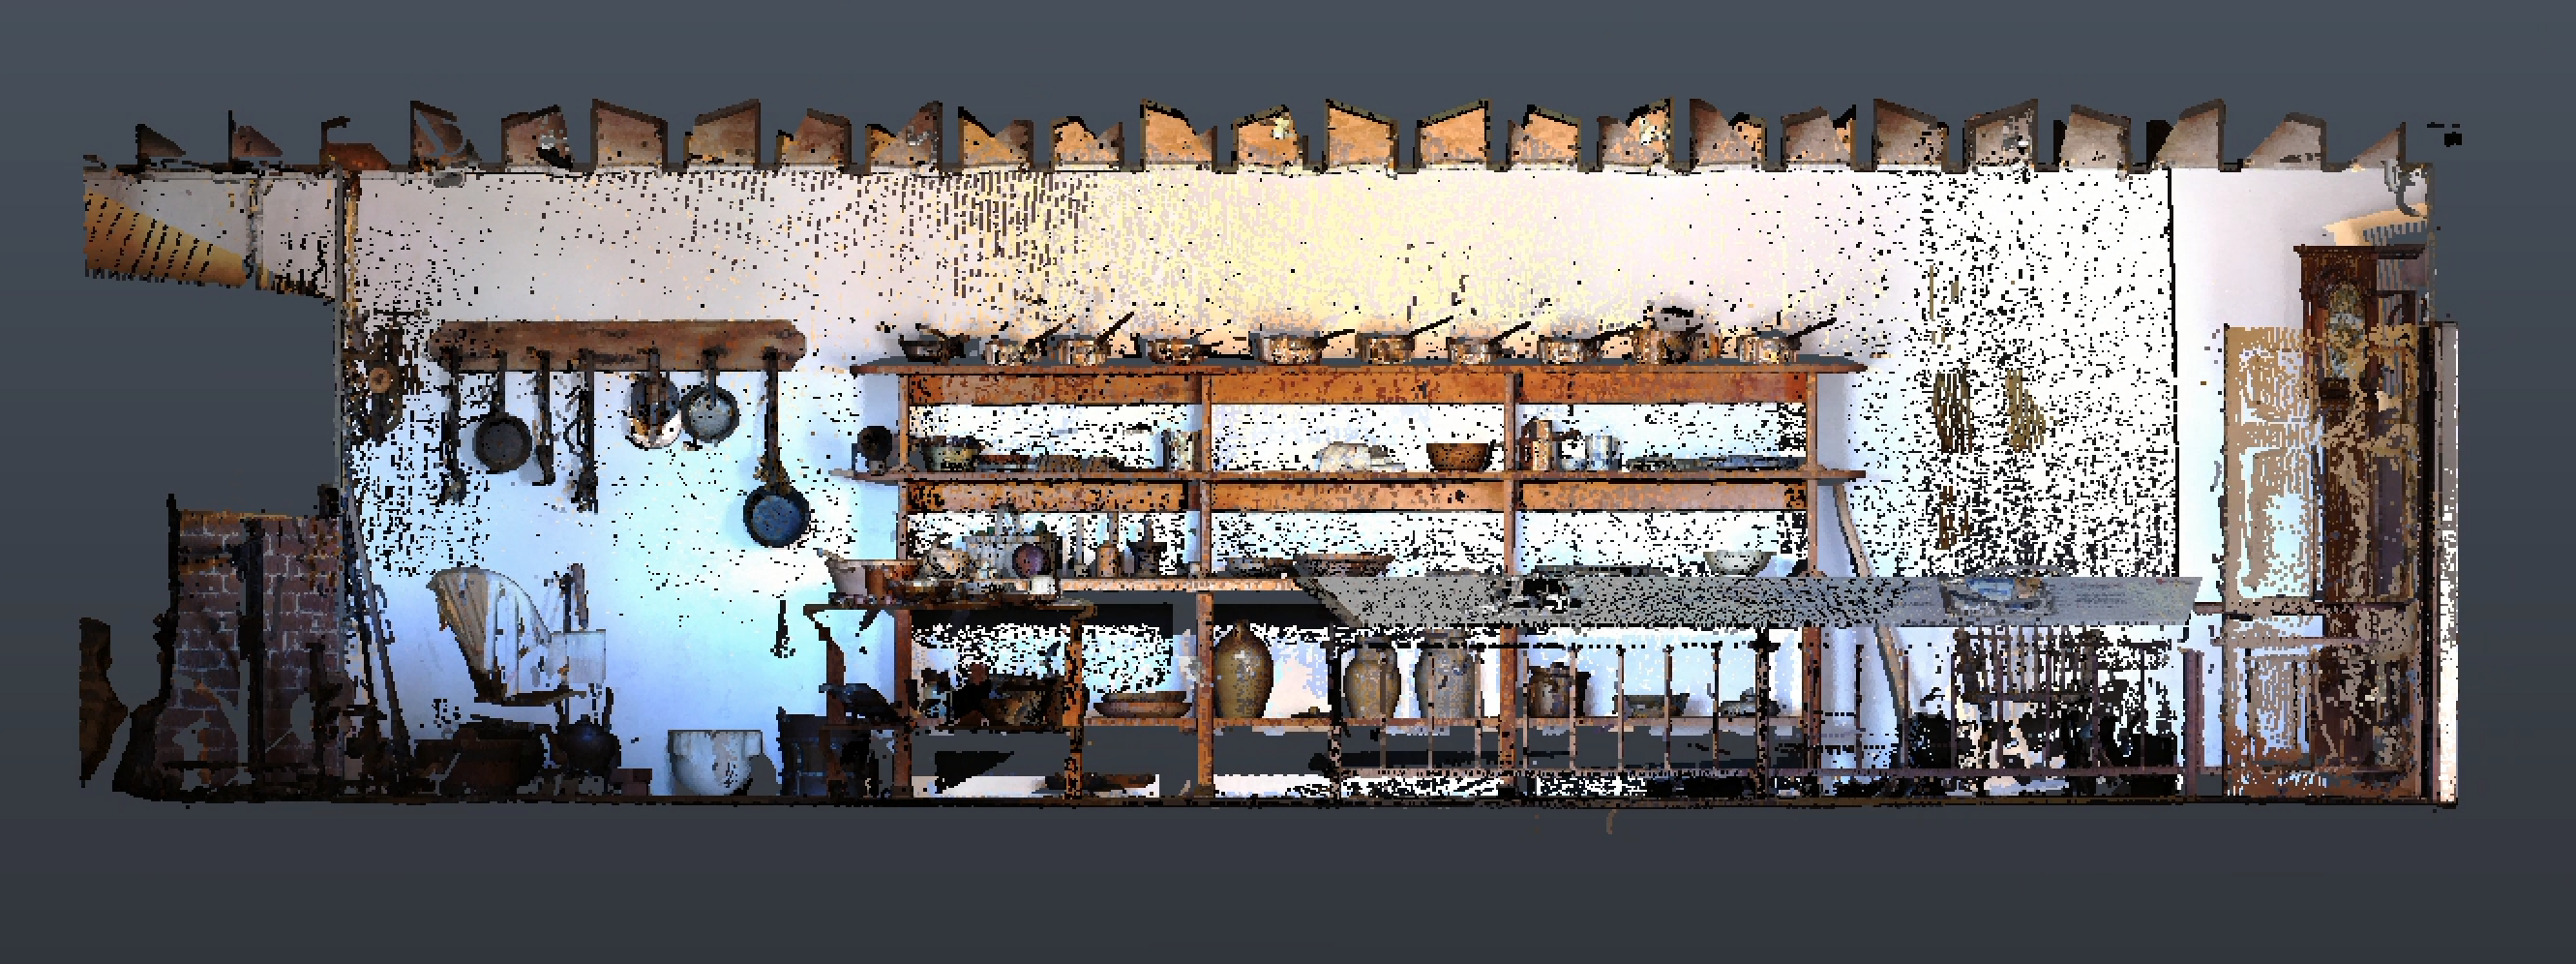
Once I had the data processed, I began to explore it using Autodesk ReCap. Using this program, I created sections, elevations, and plan drawings of the data, as well as capturing several perspective views. Lastly, I created a fly-through animation combining all of those views into a single short video.
Point cloud data can be used in ReCap to create views which reflect the actual conditions of the site

Leave a comment